![page.i18n.tmpl-gc-wmms[page.lang]](https://wet-boew.github.io/themes-dist/GCWeb/GCWeb/assets/sig-blk-en.svg)
Patterns of Human Settlement and Natural Hazard Threat in Canada: Part III: Natural Hazard Landscapes of Canada [DRAFT]
Table of Contents
Authors: M. Journeay, P. LeSueur, J. Yip, T. Hobbs, W. Chow and C. Wagner, others?
This is a work-in-progress experimentation of MS Word to Asciidoctor conversion, and figures are likely not the right place, and figure captions are currently missing. [FIXME]
Natural Hazard Threats
Natural hazards are defined as any naturally occurring process or phenomena that may pose a threat to public safety, physical assets and/or socioeconomic well-being (United Nations 2016). The severity of a hazard threat is measured by the exposure of people, buildings and/or financial assets to underlying earth system processes that are capable of causing physical damage, injury, loss and/or socioeconomic disruption. It is a general accounting of who and what are in harm’s way but is not equivalent to the more specific concepts of physical vulnerability and risk, which measure cause-effect relationships between hazard intensity and the probability of negative consequences should a hazard event occur at some point in the future.
Canada is exposed to a wide range of natural hazard threats including earthquakes, landslides, volcanoes, floods, wildfire, drought and tropical cyclones. Each of these hazards has a characteristic profile of likelihood and severity that varies as a function of both location and time horizon. Understanding the scope and severity of these place-based hazards is critical for sustainable community development yet not always available or considered. For many communities, the challenge is in sourcing the information, knowledge and expertise needed to undertake a hazard threat assessment that is robust enough to support the requirements of land use decision making. For others, there are political challenges in considering risk reduction measures that draw scarce resources away from more immediate public policy concerns (Burby 1998; Mileti 1999; Mileti and Gailus 2005).
Disaster resilience planning is about navigating pathways that balance the opportunities and constraints of sustainable development in areas exposed to natural hazard threats, where the consequences of a single damaging event can undermine the very best of community plans and policy initiatives. A goal of this study is to increase capabilities to access and make use of hazard threat information to support planning efforts by communities and organizations who otherwise would not have access to these resources. Primary audiences include emergency managers responsible for pre-event planning and operational response following a disaster event; community planners responsible for sustainable land use planning; and higher levels of government responsible for establishing guidelines and policies to protect the safety and security of Canadians.
There are two basic approaches to measuring hazard threats. The first is a statistical assessment of historical events to establish frequency-magnitude relationships that are used to predict hazard threat levels over a future time horizon. A common base of evidence for these forensic studies are hazard event catalogs and disaster databases that track the location, severity and consequences of individual events that have been directly observed or instrumentally recorded. The second is a process-based analytic approach that uses predictive models of spatial impact and hazard intensity for a given time horizon (return period) to assess the numbers of people and physical assets that are likely to be affected. Both are viable approaches that yield different but complementary insights on hazard threat profiles.
Disaster Events in Canada
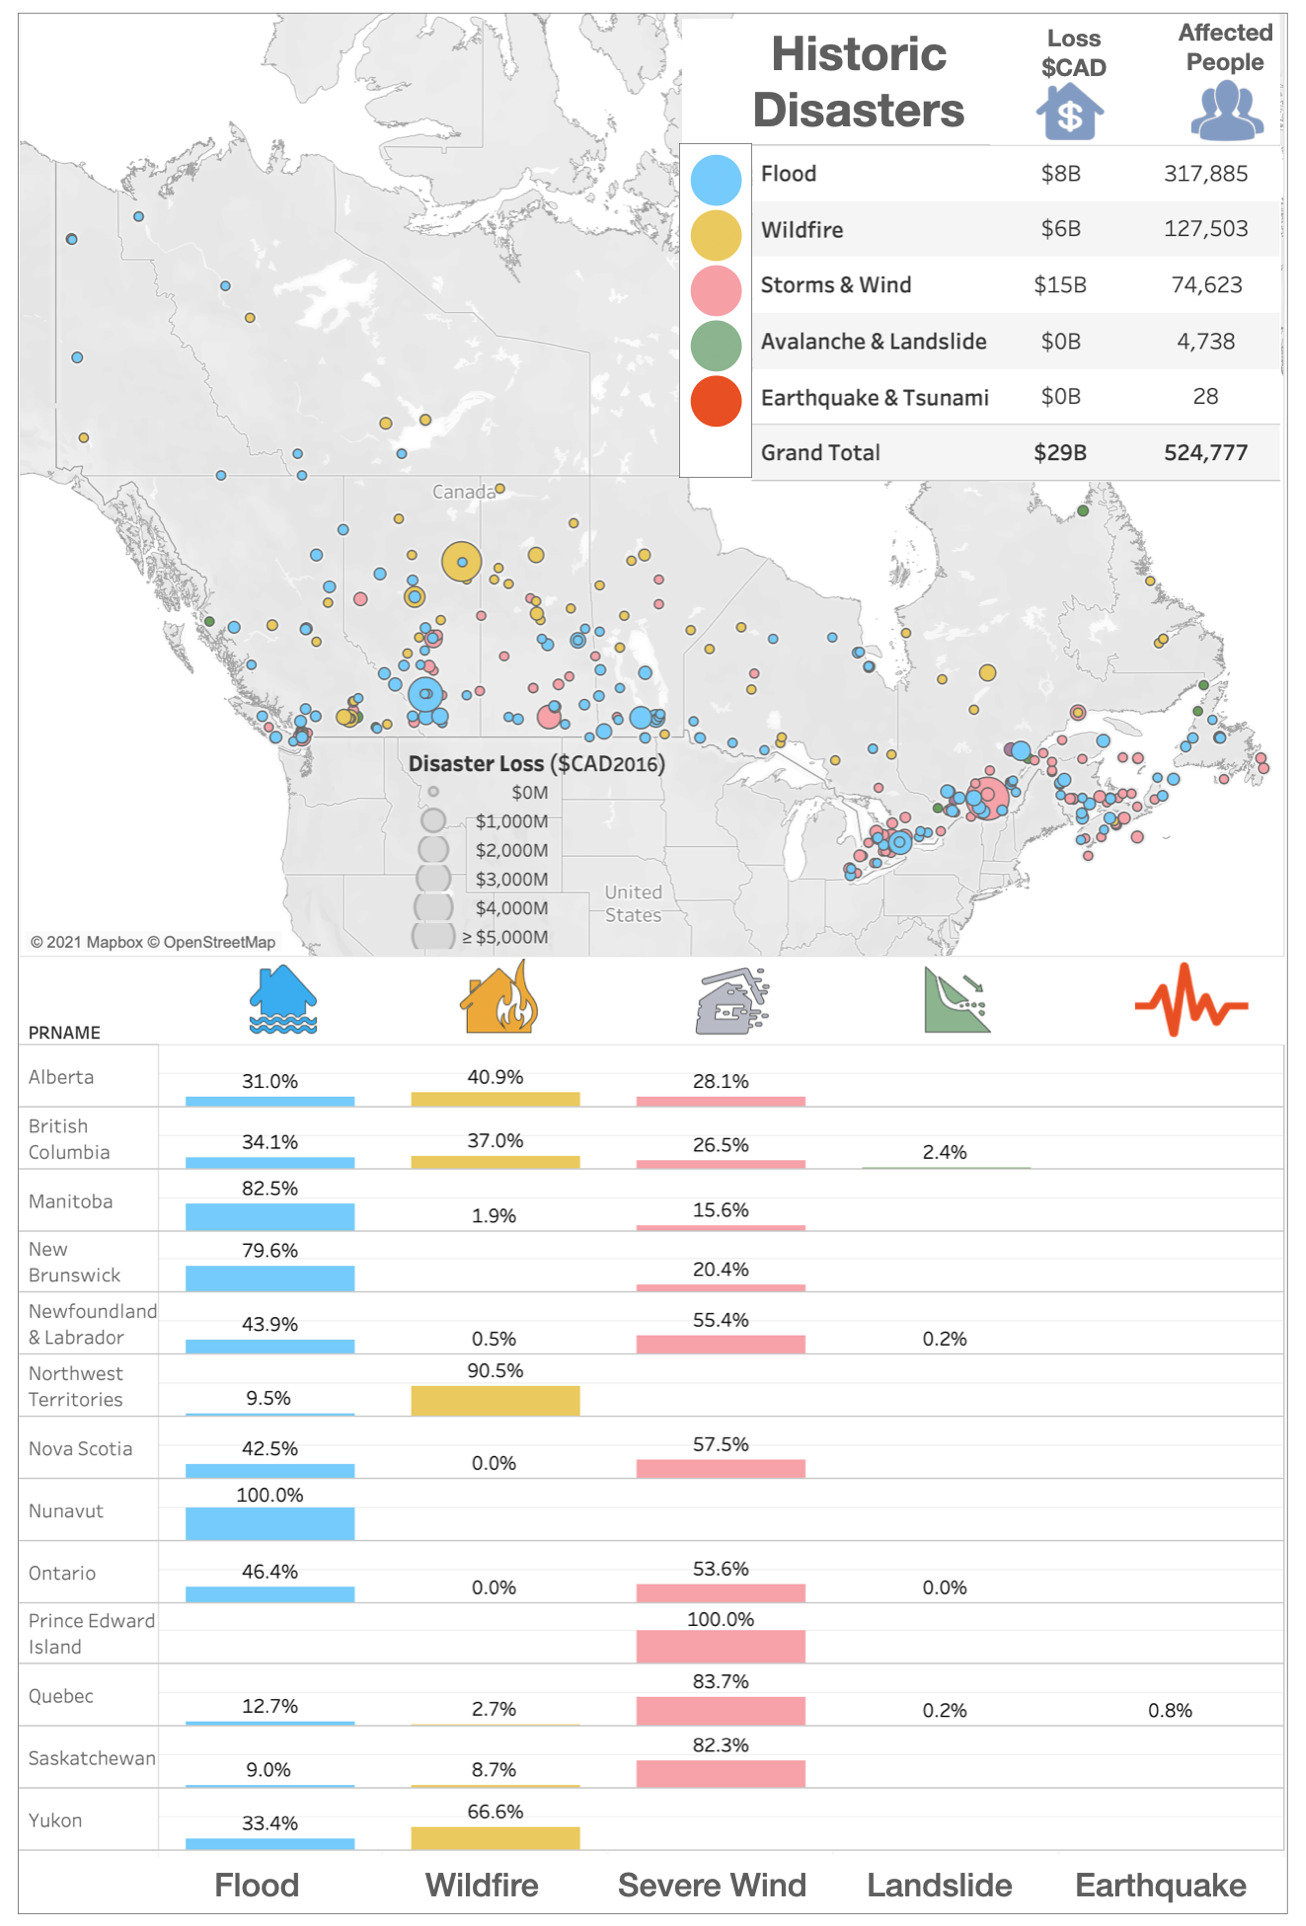
Figure 23 is a representation of Canada’s Disaster Database, which records more than 750 natural hazard events for the period between 1900 and 2018 ([Public Safety Canada 2021]). Each record is defined by an observed hazard event that has resulted in 10 or more fatalities, the displacement of more than 100 people and/or significant damage/ disruption that exceeded the capacities of local authorities to respond and recover. Cumulative losses over this period exceed ~28.7B $CAD (adjusted to 2016 values) with more than 710,000 people evacuated, ~3,150 fatalities and ~4,000 injuries. Disaster losses sustained as a result of frequent floods and severe weather events are distributed across all regions of the country with wildfire, landslide and earthquake events concentrated in mountainous regions of western Canada.
More than half of all recorded disaster losses in Canada have been caused by severe storms and cyclone events with an additional ~29% caused by floods and ~20% caused by wildfire. Although earthquakes, landslides and tsunami events contribute less than 0.5% to the overall loss profile, they are responsible for nearly 18% of all reported fatalities. A statistical analysis of loss profiles based on conditional probabilities of recorded events over a 100-year time frame suggests that hydrometeorological hazards pose the greatest threat to Canadians with an expected average annual loss of 1.8 Billion $CAD per year (Dore 2003). However, the study notes several important limitations in using a statistical approach alone to characterize hazard threat in Canada.
The most obvious limitation is that a 100-year record of disaster events skews the perception of overall threat toward more frequent but lower consequence events that exceed a somewhat arbitrary threshold of damage and loss. For example, the cumulative effects of small but recurring ‘nuisance’ events (floods, severe storms, etc.,) represent a serious threat to the economic security of many communities across Canada. However, they do not meet the established threshold of disaster loss are not included in the event catalog. Similarly, a 100-year sampling of disaster events in Canada does not reflect the lived experiences and knowledge embedded in oral traditions of indigenous communities that document a long history of devastating earthquake, tsunami, post-glacial flood and landslide events spanning several thousand years of human settlement along Canada’s west coast (Atwater et al. 2005; Becker et al. 2008; Finkbeiner 2015). Nor does it consider post-colonial accounts dating back to the early 1600’s that preserve a record of more than ~700 significant earthquake events with levels of ground shaking capable of causing significant damage and downstream consequences in settled areas of Canada (Lamontagne et al. 2018). These low frequency/high consequences events have a significant influence on the overall profile of natural hazard risk in Canada.
An equally important limitation of using statistical methods to forecast hazard threat is that patterns of human settlement and underlying natural hazard processes are not stationary over time. The levels of damage, loss and injury recorded from past disaster events do not necessarily provide a reliable measure of either current or future hazard threat. Population growth and the concentration of capital assets in areas exposed to natural hazards have increased steadily by 1-3% with the total number of people more than doubling every 50 years since 1900 (Statistics Canada 2012). A hazard event of similar intensity in any given community would have a very different profile of disaster loss in 1950 than it would today. In addition, there is not sufficient information about cause-effect relationships in most forensic disaster databases to establish a meaningful correlation between the intensity of a hazard event (water depth, wind speed, etc.,) and corresponding levels of damage or loss. Collectively, these limitations make it difficult to assess hazard threat based on a statistical analysis of past events alone.
Hazard Threat Profiles
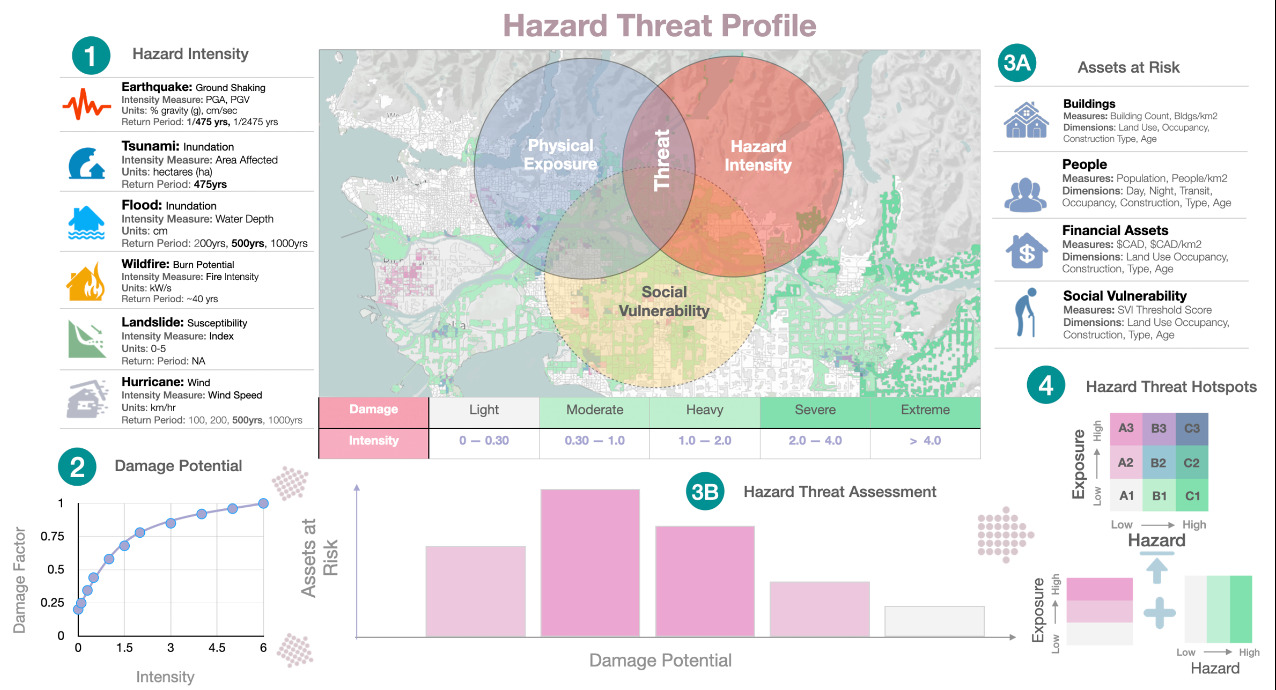
Given the limitations of event-based catalogs and the need to assess hazard threat at local and regional scales for all regions in Canada, we use a complimentary methodology that builds on available scientific knowledge and understanding to assess: (i) the expected intensity and spatial extent of hazard events for a given time horizon (frequency of occurrence), (ii) the corresponding numbers of people, buildings and financial assets that are in harm’s way, and (iii) the relative capacities of different neighbourhoods to withstand and recover from future disaster events based on overall levels of social vulnerability.
Challenges and Limitations
Assessing hazard threat across a range of different perils introduces a number of challenges (Kappes et al. 2012). These include fundamental differences in the physical characteristics of natural processes operating over different geographic scales and time horizons (extent and frequency), variations in the type and range of intensity levels across different hazard types, and the potential for interaction between hazard processes during a single event. These variables introduce significant levels of complexity and uncertainty into the assessment of hazard threat.
For example, geographically extensive hazard threats (e.g., earthquakes, tsunami hurricanes, and wildfire) are controlled by large-scale geophysical and hydrometeorological processes that can affect broad regions – each resulting in physical impacts (ground shaking, inundation, severe wind, etc.,) that can vary significantly from one location to another. At the other end of the spectrum are intensive hazards controlled by characteristics of the local geography (slope, land cover, etc.,) that affect discrete and localized areas of the landscape. Examples include debris flows and riverine floods in mountainous terrain that are physically constrained by pre-existing valley channels. Although triggered by large-scale hydrometeorological processes, the severity of these localized intensive hazard threats can be quite variable from one location to another making them more difficult to predict and to adequately represent in regional and national scale hazard threat assessments.
The temporal dimensions of natural hazard processes can also introduce significant levels of uncertainty in assessing threat levels across different perils. This includes both the frequency at which individual hazard events occur over a specified time horizon (likelihood) and the duration of time over which these events occur. In general, hazard events that occur more frequently (e.g., floods, severe storms and wildfire) tend to be less severe but represent a constant threat to people and assets. At the other end of the spectrum are hazard events that occur less frequently (e.g., earthquakes, tsunami, volcanic eruptions) but have the potential for severe physical impacts that can quickly overwhelm the capacity of human systems to withstand and recover.
In addition to general characteristics of frequency and magnitude, there are fundamental differences in the longer-term behaviour of natural system processes that affect our capacities to predict and model hazard threat. For example, the underlying hydrometeorological processes that trigger flood, woodfire and severe weather evens are strongly influenced by variations in global climate patterns that affect both the frequency and severity of events over time. Instabilities in these larger scale hydrometeorological processes can result in both sudden and severe hazard events that have the potential for extensive damage and loss. Recent hurricane and wildfire disasters in North America and across Europe demonstrate both the severity of these events and the challenges in predicting when and where they are most likely to occur in the future. The challenges of predicting rare but severe events are compounded when considering large scale geophysical processes like earthquakes, tsunami and volcanic eruptions that operate over geologic time frames yet can be triggered without advanced warning. These hazards reflect a complex set of system interactions that push the limits of available knowledge and our capacities to predict when or where future events are likely to occur.
Analytic Methods
Multi-hazard catastrophe models address the challenges of uncertainty and complexity in assessing future disaster events through the concept of physical risk, which measures the likelihood of experiencing negative consequences over a specified time horizon (Grossi, Kunreuther, and Patel 2005). Uncertainty is addressed using probability models that account for both limits in knowledge about cause-effect relationships (epistemic uncertainty) and the availability of information needed to accurately model these relationships (aleatory uncertainty). Complexity is addressed using a combination of fragility and vulnerability functions that represent performance characteristics for different types of engineered structures across a range of intensity values. The evaluation of comparative threat across different perils is addressed by integrating comparable measures of risk (likelihood of damage, loss, injury, etc.,) over a specified time horizon. Physical risk associated with different perils can be compared using either annualized average metrics of damage and loss, or the probability of exceeding a threshold of damage or loss over a given planning horizon.
Although catastrophe models do exist in the public domain for analyzing earthquake risk at a community level across Canada (e.g., Journeay et al. in prep.; Silva et al. 2018; Silva et al. 2020), similar capabilities are not yet developed to allow a national level multi-hazard risk assessment across different perils. More specifically, we currently lack an integrated suite of public domain fragility and vulnerability functions that relate intensity measures across a range of hazard types to corresponding probabilities of damage and loss for specific types of buildings.
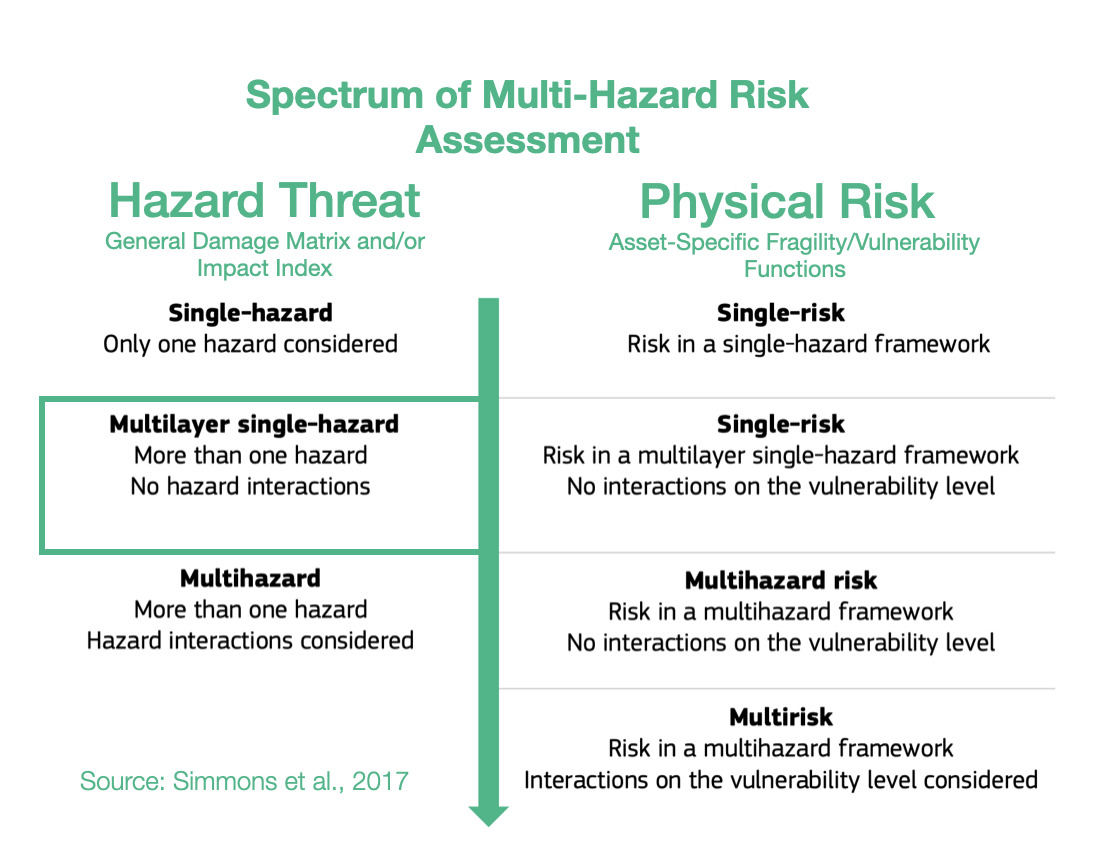
In the interim, we have adopted a multilayer/single-hazard approach for comparing the relative severity of different perils in terms of both likelihood and potential for damage (Blong 2003a, 2003b; Simmons et al. 2017). The methodology (Figure 24) mirrors that of a multi-hazard risk assessment but measures the potential for negative impacts in terms of overall physical exposure and susceptibility to damage for a common time frame rather than using engineering-based fragility and vulnerability functions to measure the physical impacts to specific elements of the built environment over a range of future time horizons. A schematic of our overall methodology is summarized in Figure 25.
Hazard likelihood is expressed using the concept of Annual Exceedance Probability (AEP), which measures the chances of experiencing a future hazard event of a specific magnitude or greater in any given year. For example, frequent flood events that occur on average once every 50 years would have a corresponding AEP of ~2% (0.0199). By comparison, rare but potentially damaging events that are likely to occur over a longer time horizon of 500 years would have a corresponding AEP of 0.2% (0.00199). The use of AEP as a measure of likelihood accounts for the possibility that a hazard event of greater magnitude could occur in any given year and provides a common framework for comparison across perils. It also minimizes confusion that is often associated with the more common measure of return period where people mistakenly assume that if a 500-year event has just occurred, it is not likely to happen again for another ~499 years.
Similar approaches and methods have been used to establish a common framework for harmonizing multi-hazard threat assessments across a variety of geographic scales. Examples include regional and national-level assessments carried out across Europe to support spatial planning and emergency management operations (Margottini et al. 2008; Delmonaco, Margottini, and Spizzichino 2007; Tyagunov et al. 2006; Greiving, Fleischhauer, and Wanczura 2006; Klein, Greiving, and Jarva 2006), national and global scale assessments carried out to report on Sendai framework targets for disaster risk reduction (Marin-Ferrer, Vernaccini, and Poljansek 2017; De Groeve, Poljansek, and Vernaccini 2015), and global assessments of risk dynamics and the compounding effects of urbanization to support implementation of the international Sustainable Development Goals (SDGs) and broader policy goals established as part of the COP21 Paris Agreement to manage the effects of climate change (Pesaresi et al. 2018) .
Step 1: Establish Hazard Profiles
The process of evaluating hazard threats begins with the compilation of available hazard assessment information for which there are comparable measures of event magnitude and likelihood to establish equivalency across perils. The collection of hazard types used in this study includes various open source global models for floods (Rudari et al. 2015; Dottori, Salamon, et al. 2016), cyclonic wind (Yamin et al. 2014; UNISDR 2015) and tsunami (Løvholt et al. 2015); and national-level models developed for wildfire (Taylor, Pike, and Alexander 1996; Lee et al. 2002; Parisien et al. 2005; Gralewicz, Nelson, and Wulder 2012; Taylor and Alexander 2018) and for earthquakes (Adams et al. 2015a; Halchuk, Adams, and Allen 2015; Adams et al. 2019). Hazard intensity is evaluated for an AEP of 0.2% across all hazard types to establish a basis for comparing damage potential. This corresponds with a 10% probability of occurrence over a 50-year time horizon and aligns with regulatory risk tolerance guidelines used in Canada to evaluate the capacity of financial institutions to withstand and recover from the sudden economic shocks of a disaster event (OSFI 2013a, 2013b). The exception is for national wildfire models, which forecast mean hazard intensity of ignition over a ~50-year time horizon for all regions in Canada based on an assessment of underlying causal factors and evolving hydrometeorological conditions.
Additional national level models were evaluated for landslides and volcanic hazards. However, both currently lack key measures that are needed to make a meaningful comparison with other hazard types in the collection. The NASA Landslide Hazard Assessment for Situational Awareness (LHASA) is based on heuristic modeling of underlying conditions of topography, bedrock materials, soil moisture and other variables that are known to cause slope failure when triggered by severe rainfall and/or earthquake ground shaking events (Kirschbaum and Stanley 2018; Stanley and Kirschbaum 2017). Slope stability hazards are expressed in terms of a susceptibility index that is used in conjunction with real-time weather data to forecast areas that are likely to pose a threat to human settlement. However, index values do not represent intensity thresholds or event probabilities for specific causal events (e.g., debris flows, risk falls, slope failures, etc.,) that are needed to assess damage potential and equivalency with other hazard threats.
National-level assessments of volcanic hazards in Canada provide valuable insights on potential threats posed by explosive ash fall and lahar events both in terms of hazard footprints, likelihood of occurrence and relative magnitude (Kelman 2015). More recent work has established a formal ranking of volcanic threats in Canada based on detailed characteristics of hazard potential and physical exposure (ref). However, model outputs are reported as relative index values that are not directly comparable with other hazard types considered in this study.
It is worth noting that the field of natural hazard assessment is rapidly evolving in Canada due to an increased demand for scientific information to support risk-based planning at a community level, and broader efforts across various levels of government to establish guidelines for disaster risk reduction in accordance with policy goals established as part of the Sendai Framework (Public Safety 2012; Public Safety Canada 2013; Ploeger and Ladd 2016). We anticipate that new and more detailed hazard assessments will soon become available in the public domain to support the quantitative assessment of flood and woodfire risk across Canada. In the interim, methodologies and model outputs described here provide a baseline for assessing overall threat for key hazards of concern, and a framework for developing a more refined understanding of disaster risk as new information and modeling capabilities becomes available.
Step 2: Assess Potential of Direct Physical Damage
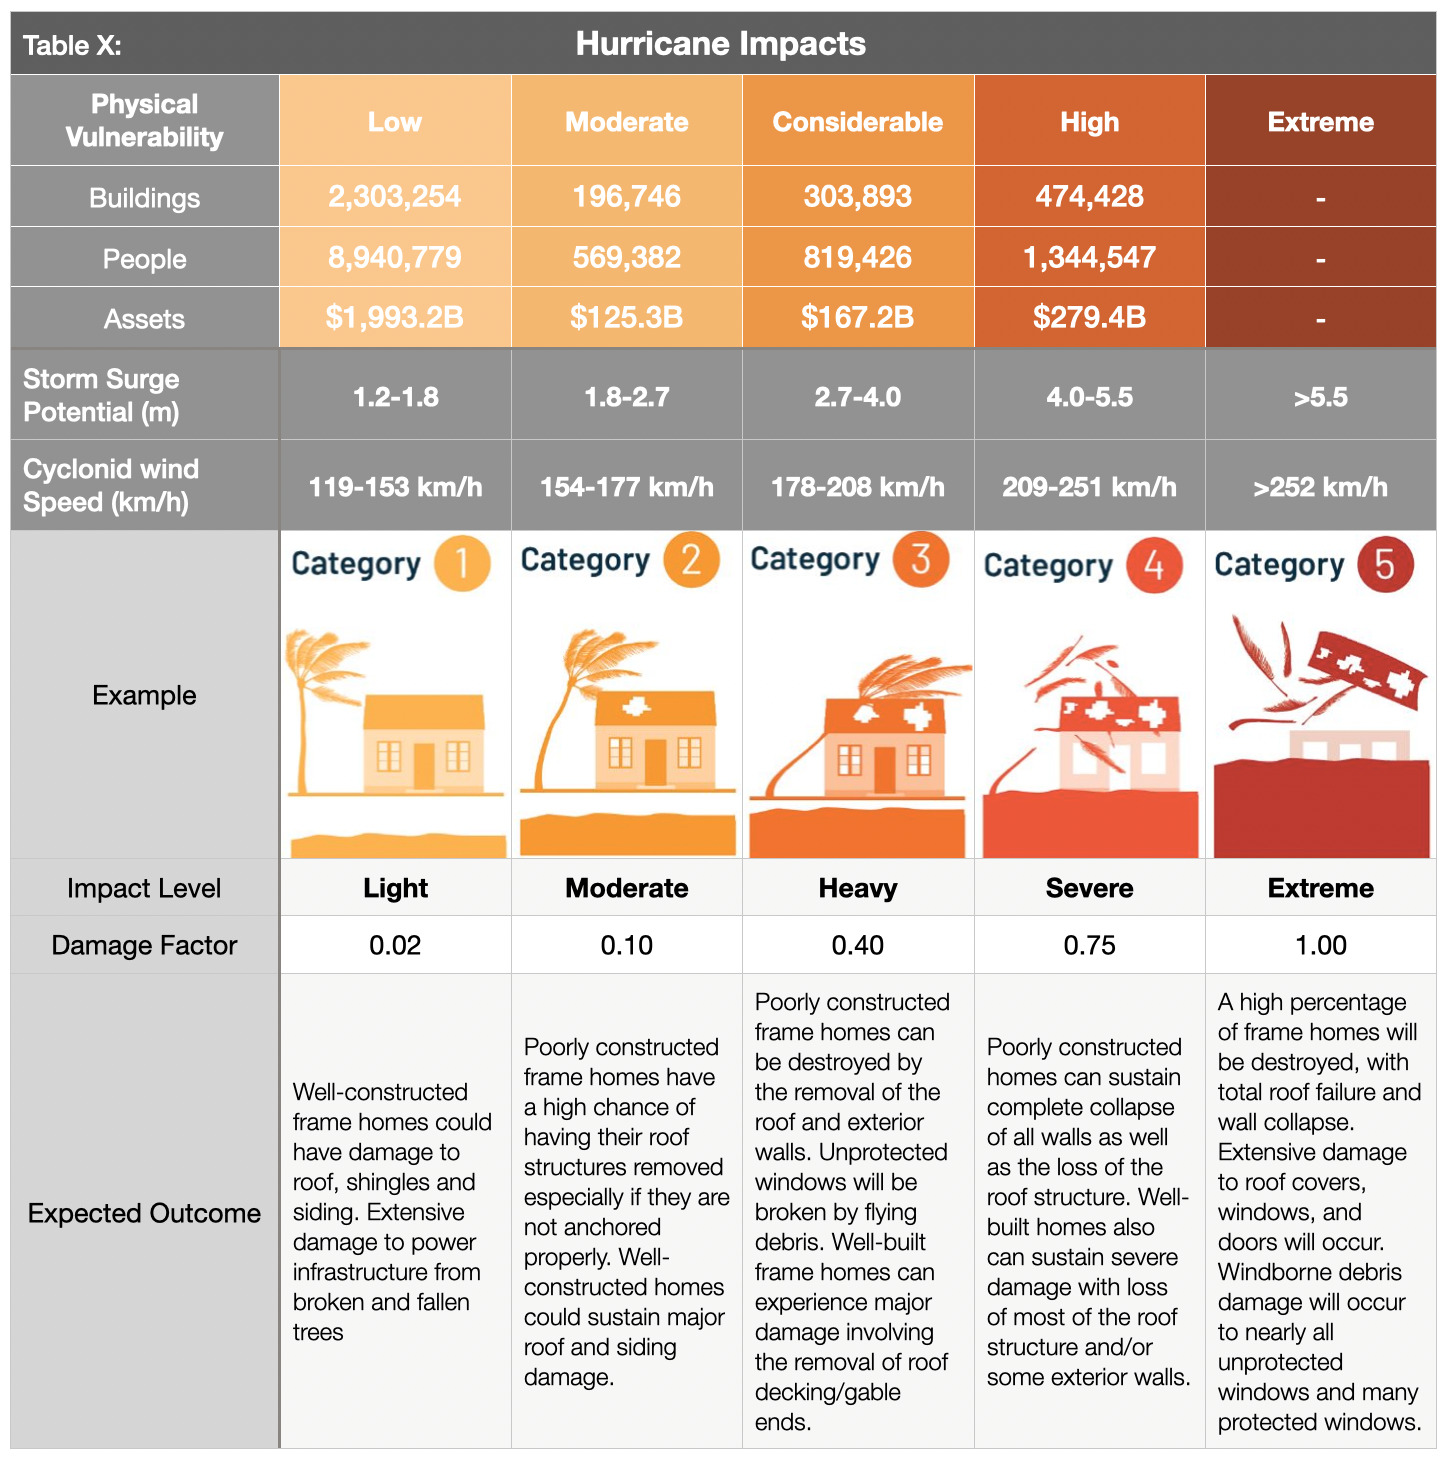
The assessment of damage potential is based on established impact scales developed to inform emergency management and community planning decisions across a range of perils (See Table X). The scales are designed to transform a scientific understanding of hazard intensities into a narrative description of expected outcomes for both long range strategic and operational planning decisions.
Impact scales used in this study include the Modified Mercalli Index for earthquakes (Wood and Neumann 1931; Stover and Coffman 1993; Wald et al. 1999), generalized depth-damage functions for riverine floods (Margottini et al. 2008; Huizinga, Moel, and Szewczyk 2017), the Wildland Urban Interface (WUI) fire hazard index (Maranghides and Mell 2013), and the Saffir-Simpson cyclonic wind scale for severe storms and hurricanes (Taylor et al. 2010). Levels of physical damage for tsunami are inferred from impact scales developed for other multi-hazard threat assessment studies using equivalent intensity measure types (Blong 2003b; Greiving, Fleischhauer, and Wanczura 2006; Delmonaco, Margottini, and Spizzichino 2007; Margottini et al. 2008).
Step 3: Evaluate Assets at Risk
The relative severity of hazard threat is measured for each peril by counting the numbers of people, buildings and financial assets in each settled area (SAUID) that are exposed to intensity thresholds capable of causing damage and/or socioeconomic disruption. Information used for this step of the process is based on outputs of the NRCan physical exposure model for Canada , which is derived from reference population and building counts established as part of the current national census (Statistics Canada 2016).
Time-dependent variations in hazard threat are measured by intersecting population grid points of the Global Human Settlement Layer (GHSL) with hazard intensity measures of different perils for reference time periods of 1975, 1990, 2000 and 2015 (Pesaresi et al. 2016). As noted elsewhere in this study and in a recent benchmarking of population models used to assess flood hazard threats in Canada (Mohanty and Simonovic 2021), the Global Human Settlement Layer tends to underestimate population counts due to limitations of the sensors in detecting sparsely settled communities in rural/remote settings. Nonetheless, the clear delineation of settlement boundaries in more densely settled regions of Canada provides important insights on underlying risk dynamics that have evolved over time in response to the pressures of increased urbanization
Included in our evaluation of hazard threat is a consideration of relative capacities to withstand and recover from the impacts of different hazard threats based on outputs of a social vulnerability model developed as part of this study (Ref). Social vulnerability focuses on the underlying characteristics of social systems that exist prior to a disaster event that can predetermine the degree to which members of a community may suffer harm. Threshold scores for each dimension of social vulnerability are incorporated as a separate component of the hazard threat assessment to identify who is likely to bear the greatest burden of risk for a given peril based on underlying characteristics of housing conditions, family structure, individual autonomy and financial agency.
Rather than aggregate measures of threat and social vulnerability for each peril into a composite multi-hazard index (e.g., Greiving, Fleischhauer, and Wanczura 2006; De Groeve, Poljansek, and Vernaccini 2015; Marin-Ferrer, Vernaccini, and Poljansek 2017), we report separate measures for each level of damage to increase both transparency and the usability of model outputs for emergency management and community planning (Step 3B). However, hazard threats that exceed a particular threshold can be ranked for each peril and reported as percentiles to facilitate a comparison across settled areas at regional and/or national scales while still providing absolute measures of key input parameters.
Step 4: Visualize Hazard Threat
Understanding patterns of hazard threat requires integrating multiple variables of hazard, exposure and vulnerability while retaining the ability to explore spatial relationships and interactions between each. A common approach when working with geostatistical data is to combine univariate choropleth maps representing spatial variations of a single indicator value with corresponding charts and/or tables that summarize relevant variable statistics for the region of interest. This works well in the context of census data, providing that values used to visualize spatial patterns are normalized to minimize distortions introduced by irregularities in the size of enumeration areas, and that care is taken to categorize the data in a way that honors statistical characteristics of the variable being measured. However, in the context of hazard threat, this approach would likely push the cognitive limits of human vision and perception as multiple sets of visualizations would be needed to make evident the interactions between variables (Olson 1981; Montello 2002)
Bivariate choropleth maps are intentionally designed to make evident the spatial relationships and interactions between variables (Leonowicz 2006). The method combines two separate variables on a single map using mathematically derived representation schemes in which color tone is used reflect both statistical distributions and spatial relationships between variables for a given region of interest. The degree of overlap between variables and the geographic distribution of map patterns that reflect these interactions can be used to infer cause-effect relationships within large heterogenous datasets that would not otherwise be evident (MacEachren and Kraak 2001).
The construction of bivariate maps to visualize patterns of hazard threat involves a consideration of both the natural and human processes that are likely to influence causal relationships and characteristics of the data used to represent these processes. First, value distributions for each variable are used to categorize the data into statistically significant groupings. Class selection is limited to intervals of low, medium and high resulting in a 3x3 matrix of variable combinations that represent the range of interactions between damage potential and exposed assets at risk. Once class boundaries have been defined, unique combinations between hazard and exposure variables are classified (low-low, medium-high, etc.,) and geographically represented using latitude/longitude coordinates for corresponding census enumeration geometries.
The goal is to enable users to read values for each of the variables independently while at the same time showing how interactions between these variables are distributed geographically (Leonowicz 2006). For example, areas of overlap between moderate damage potential and low asset exposure have a very different meaning that areas with equivalent damage potential and high asset exposure. Similarly, correlations between areas of high damage potential and high social vulnerability provide additional insights to assist emergency managers and community planners in undertaking more detailed follow-up studies of specific neighborhoods to determine what resources and/or services may be needed by different population groups to increase capacities to withstand and recover from future disaster events.
The following sections explore the relationships between patterns of human settlement and hazard threat across Canada. We review correlations between published hazard assessments, significant historic events and characteristics of both urban form and social vulnerability that contribute to threat profiles at local and regional scales. Model outputs for each peril are used in conjunction with historic population data from the Global Human Settlement Layer to identify hotspot regions of concern across Canada, and to document how patterns of hazard threat have changed over the past ~40 years in response to increased growth and development.
Floods
Flooding in Canada is widespread and frequent (Figure 26). It includes the effects of fluvial processes that overtop natural and manmade levees resulting in the inundation of river valleys, heavy rainfall events that trigger rapid runoff and accumulation of pluvial waters in low-lying areas, and severe coastal storms that result in high wind and inundation caused by storm surge (Etkin, Haque, and Brooks 2003; Etkin 2010). The impacts of riverine flooding processes can be significantly amplified by temperature variations resulting in additional runoff from snow-covered terrain in the Fall and Winter months, and rapid melting of heavy snowpack and the blocking of river systems by ice jams in the Spring. Similarly, coastal flood hazards can be amplified by the compounding effects of heavy rainfall and high winds that push water onshore from the ocean and large inland lakes.
The impacts of flood hazards are well known to Canadians and have affected communities in all areas of Canada to varying degrees throughout our history of settlement. This is not surprising as river valleys, floodplains and coastal areas have continued to attract growth and development because of the amenities they offer for agriculture, transportation and commerce. Perhaps the most dramatic examples of living with flood risk come the oral traditions of indigenous peoples who adapted their lives and livelihoods to reflect a variety of flood hazard threats associated with an active post-glacial landscape. Catastrophic events over this period of time included large dam outburst floods that inundated and destroyed entire communities, debris flow events triggered by the collapse of unstable slopes in mountainous terrain and fluctuations in river levels that affected patterns of settlement over time.
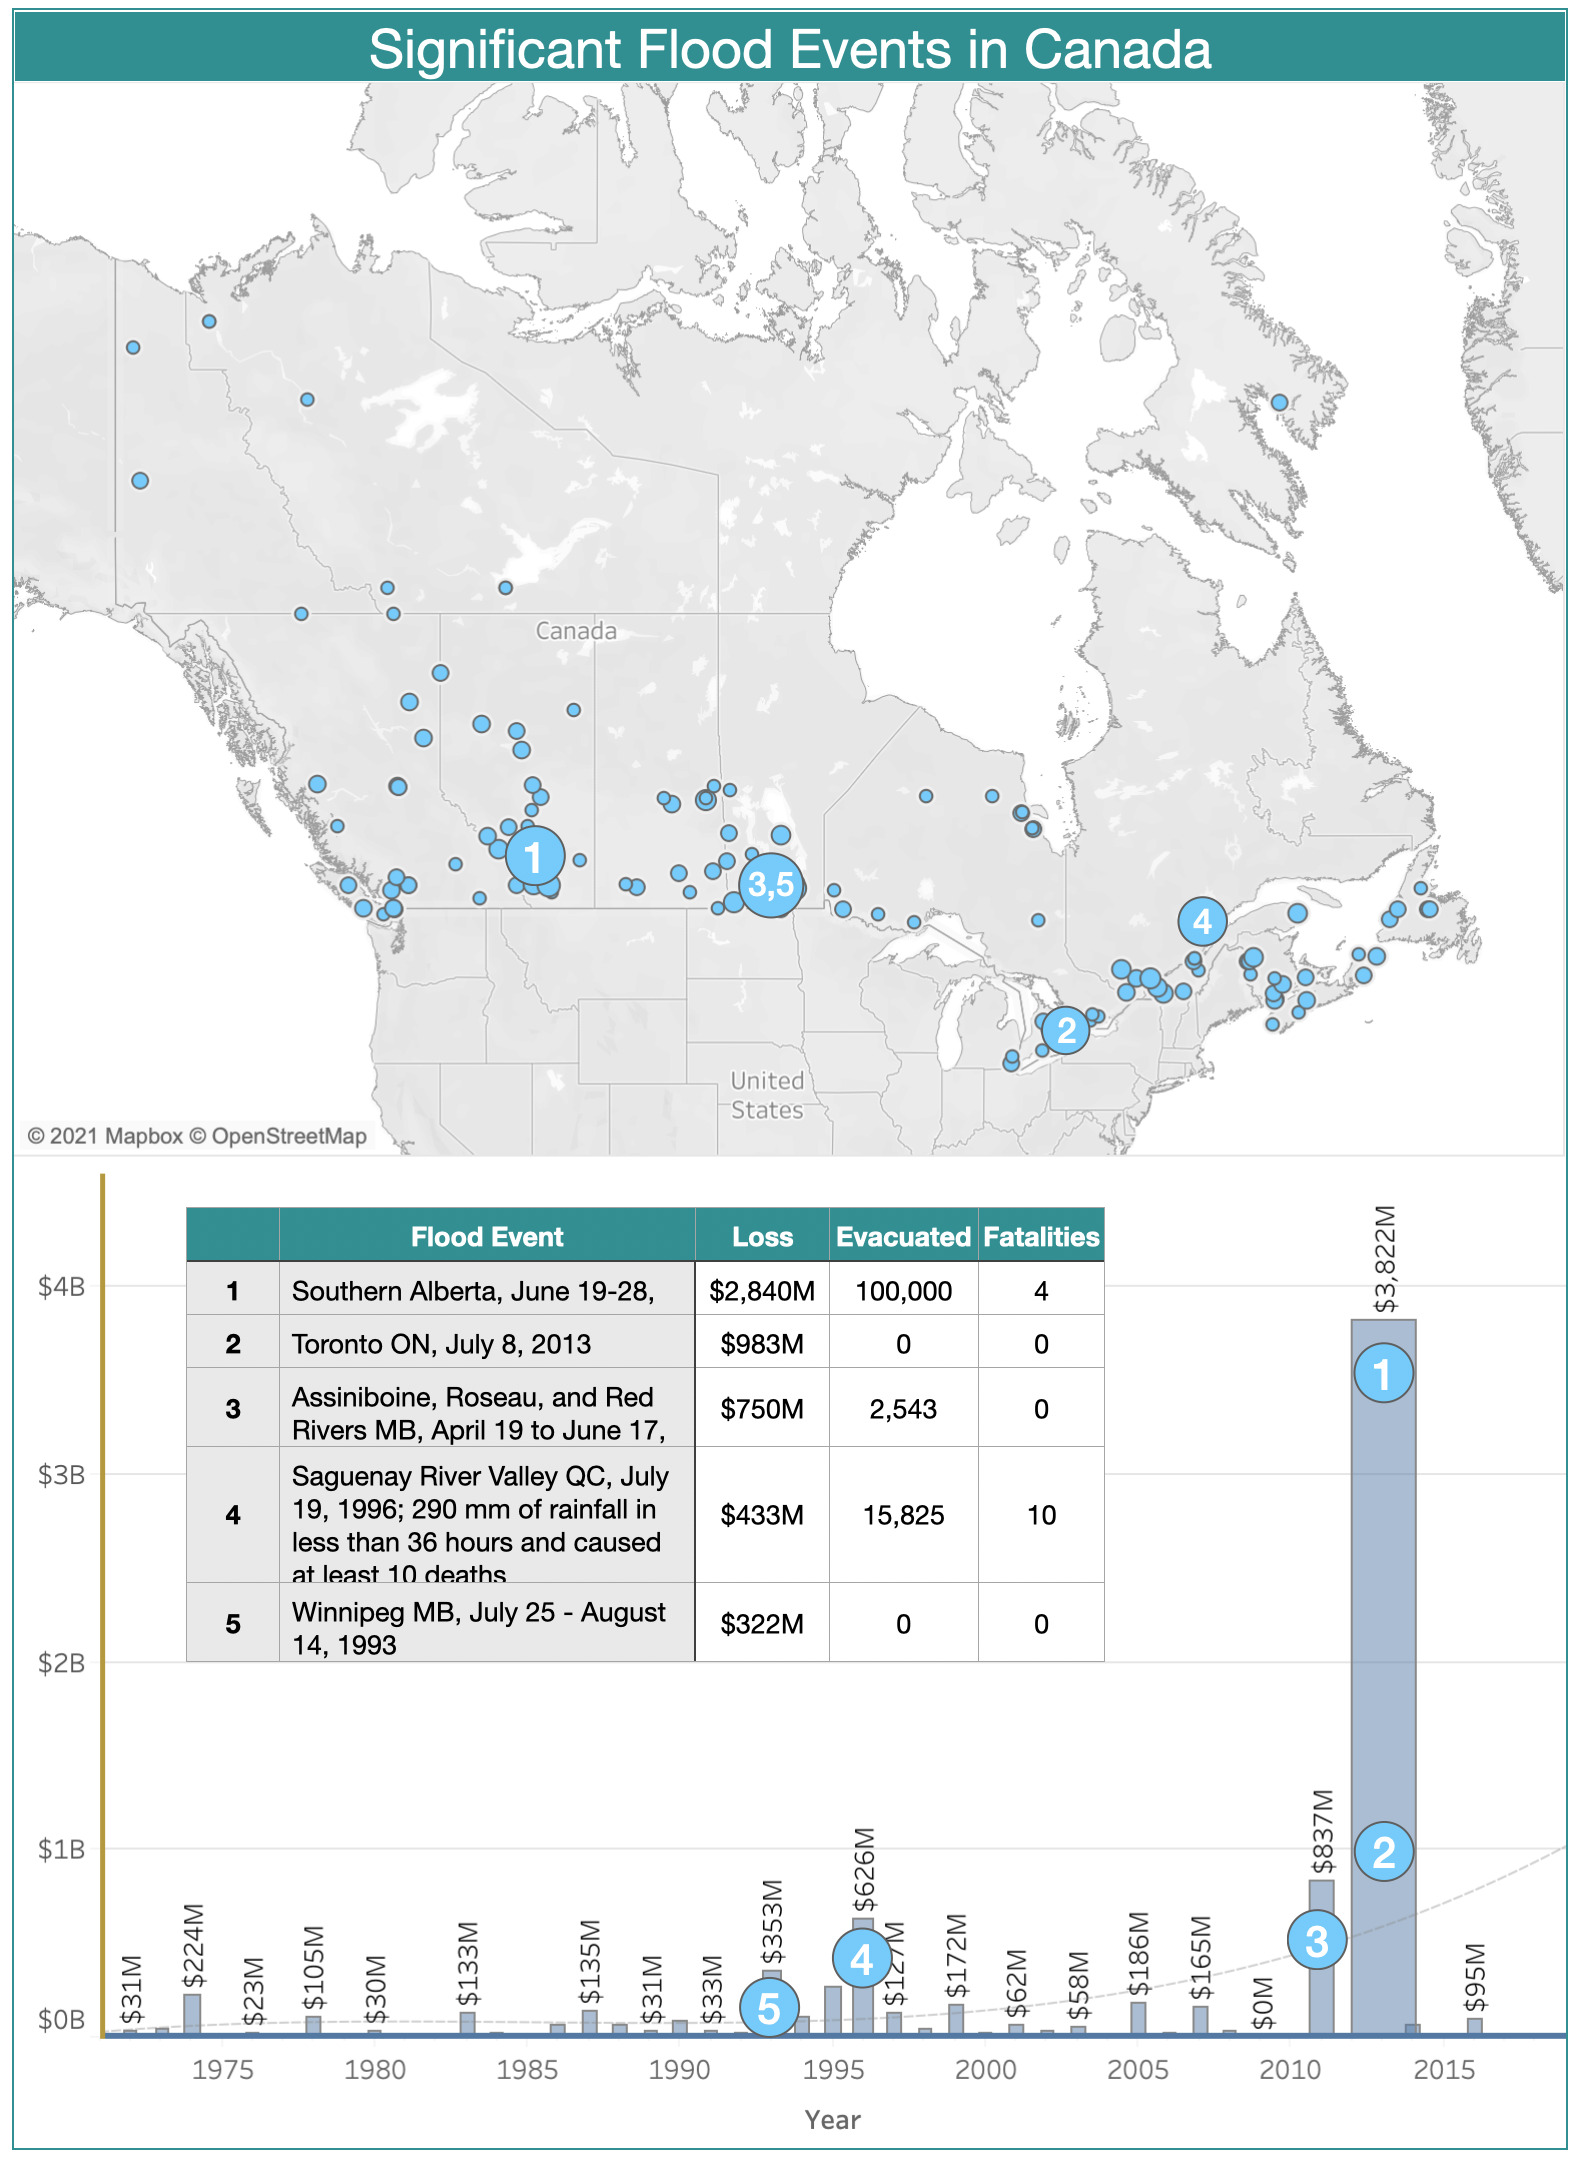
The Canadian Disaster Database records more than 270 major flood events between 1970 and 2016 that have resulted in the evacuation of ~337 thousand people, 115 fatalities and ground up losses in excess of 8.2B $CAD (Public Safety Canada 2021). Notable disaster events include flash floods in 2013 that were triggered by severe storms and affected communities in the Toronto area and southern portions of Alberta (Calgary, Canmore, High River, Medicine Hat); riverine flooding along the Assiniboine, Roseau and Red Rivers of Manitoba in 2011; extreme rainfall and flooding along the Saguenay River Valley of Quebec in 1996; and major flooding along the Red and Assiniboine rivers in 1993 that affected broad regions of Winnipeg and Regina (See Figure 27). While extreme flood hazards will continue to shape our profile of disaster risk in Canada, it is the frequent occurrence of small but damaging riverine and pluvial flood events that has amplified the cumulative impact over the past several hundred years of settlement. These trends are escalating at an alarming rate due to increased growth and development in hazardous areas and the compounding effects of extreme weather events triggered by climate change (Figure X). The cumulative insured losses associated with property damage now exceed those related to fire and theft (Friedland, Cheng, and Peleshok 2014; Oulahen 2015).
Riverine Flooding
Analyzing and mapping flood hazards at a continental scale is a challenging task, particularly for a country as large and as geographically diverse as Canada. While the concept of measuring how much water is likely to exceed river channel capacity and inundate surrounding regions is relatively straightforward, the scale of a national or global model requires innovation on several fronts. This includes the compilation of massive river flow and/or climatological datasets and the development of integrated modeling frameworks capable of simulating both discharge characteristics and flow routing along drainage systems that can be several hundred kilometres in length and involving multiple flooding processes.
Flood hazard modeling in Canada is rapidly evolving with several viable private and public sector models to choose from; each with a characteristic set of strengths and weaknesses. These include a patchwork of engineering-based hydrologic models used for site-level assessments and community planning, high-resolution national models used in the private sector for assessing flood risk — and a suite of open source global flood hazard assessment models that provide national coverage for all regions in Canada with varying degrees of resolution (Trigg et al. 2016). The SSBN model (Sampson et al. 2015) offers high-resolution riverine flood hazard data at 90m resolution. Although prospective, outputs of the SSBN and comparable private sector models are not currently available for use in the public domain. However, they are likely to be incorporated into a national hazard threat and risk assessment framework at some point in the near future to improve spatial resolution and usability of the framework for emergency management and community planning (Golnaraghi et al. 2020).
In the interim, we have selected two representative global riverine flood hazard models for comparison; the UNEP model (Rudari et al. 2015) developed to support the 2015 Global Assessment Report (Desai et al. 2015), and the JRC model developed by the Joint Research Commission (Dottori, Salamon, et al. 2016) to support implementation of an early warning system for the European Centre for Medium Range Forecasts (ECMWF). While these global flood hazard models do not have the spatial resolution needed to support local planning, they do provide a suitable base for regional assessment and the comparison of relative threat across other hazard types of concern in Canada.
The UNEP model (Rudari et al. 2015; UNDP Global Risk Data Platform 2015) is based on a global stream flow dataset of ~8000 stations that is used to calculate river discharge profiles over multiple time horizons for characteristic drainage basin. A downscaling technique is used to account for the regional effects of both frequent and extreme flood events. Resulting probabilistic discharge profiles are integrated with hydraulic cross sections to compute flood levels for time horizons of 25, 50, 100, 200, 500 and 1,000 years (AEP range of 4% to 0.1%). Flood elevations are then integrated with high resolution SRTM topographic data (~90m resolution) to identify flood inundation zones using a simple hydraulic model. Flood hazard footprints are then merged to create continental-scale flood hazard maps for different AEP thresholds at 30 arc second (~1km) resolution.
The model accounts for multiple flooding processes including discharge over large floodplains, river channel-floodplain interactions and anticipated variations in precipitation and temperature caused by the effects of climate change. However, the scale of resolution does not allow for a detailed assessment of flood extent on broad river deltas or the effects of local flood defence measures. As a result, the UNEP global model tends to overestimate water depths for shorter return periods and the spatial extent of flooding over broad deltas and interior basins in which there are small variations in topographic elevation. The merging of synthetic flood inundation zones to create continental scale hazard maps with a spatial resolution of ~1 kilometre also introduces significant uncertainties when estimating assets at risk using census-based data. A strength of the model is that is uses detailed hydrographic network data and downscaled regional discharge profiles to simulate riverine flood hazards along smaller drainage systems that are not captured in other global models. As with other global models, simulated flood extents for specific AEP thresholds are validated using historic flood footprint data with varying degrees of correlation.
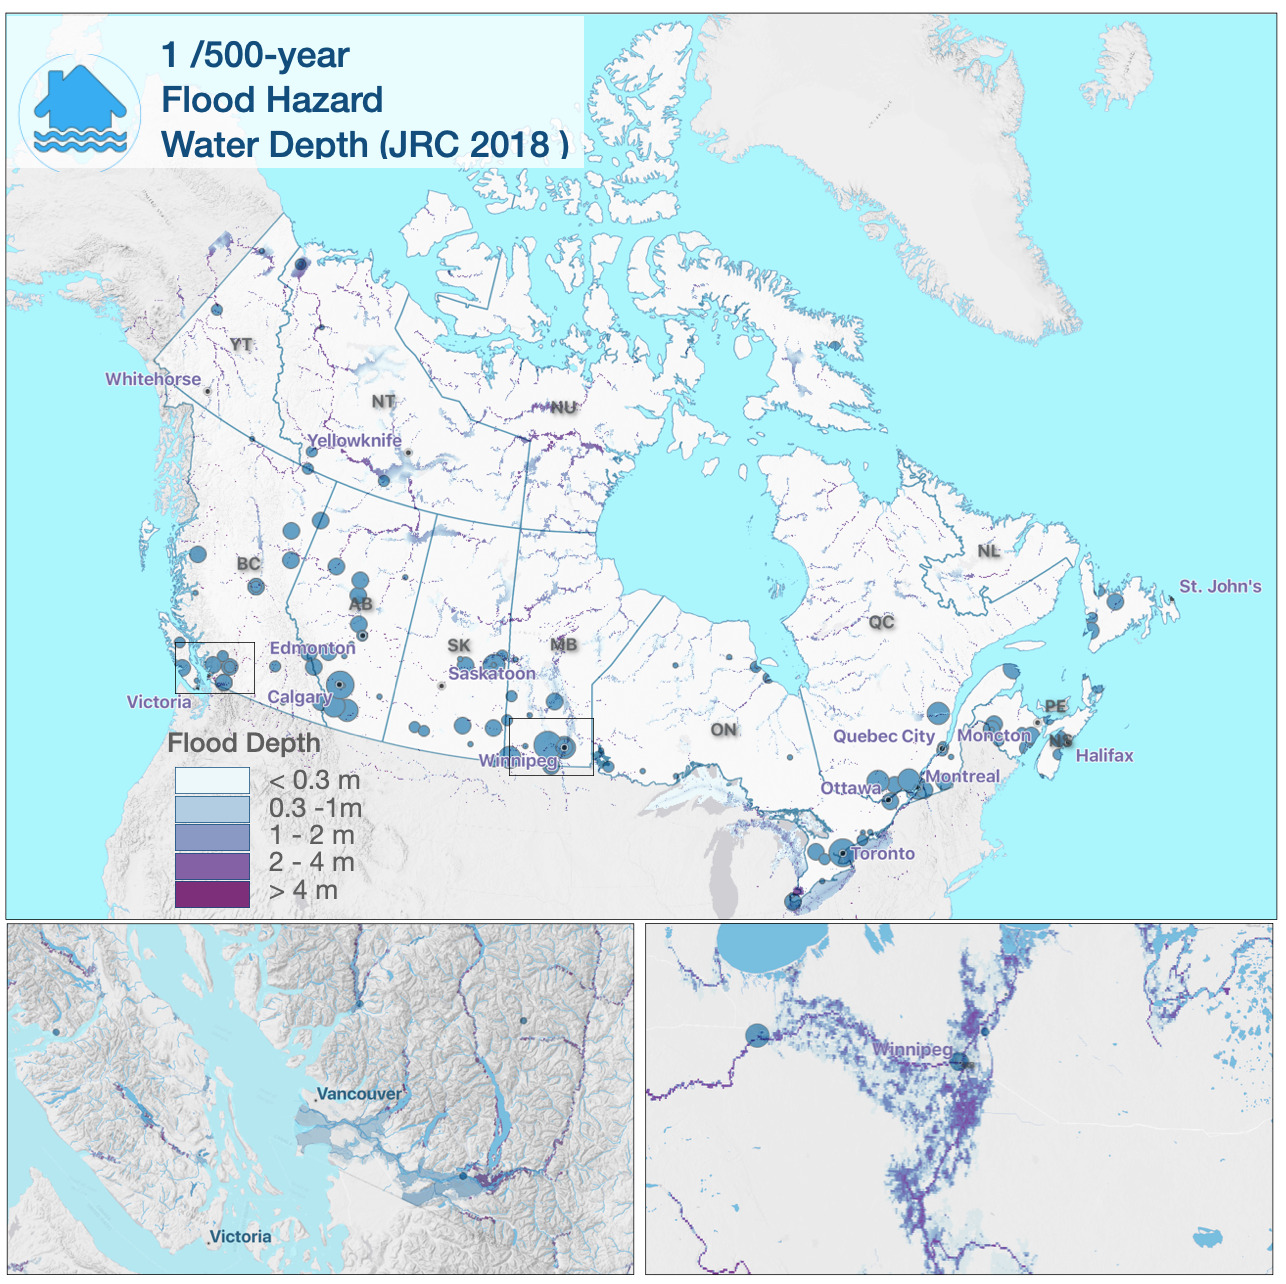
The JRC model (Dottori, Salamon, et al. 2016; Dottori, Alfieri, et al. 2016) is designed to support operational requirements for situational awareness and the forecasting of extreme flood events (Alfieri et al. 2013). The overall approach is similar in concept to that of the UNEP model with a few notable exceptions. First, instead of using recorded stream flow data to generate river discharge profiles, the JRC model uses climatological forecasts of precipitation and groundwater/surface runoff models generated as part of the GloFASS monitoring network to estimate both water volume and rates of flow at reference points along a drainage network. Daily annual discharge maxima are extracted for each grid element along the river network and used to estimate discharge rates for time horizons of 10, 25, 50, 100, 250, 500 and 1,000 years (AEP range of 10% to 0.1%).
A second important difference is that the resolution of climate-derived forecast data mean that discharge profiles are only considered for major river networks with an upstream drainage area larger than 5,000 kilometres. Importantly, this excludes vast networks of smaller river networks in Canada that are a source of frequent seasonal flooding events and of concern for local community planning. Daily and extreme discharge profiles are downscaled to flood points that are used to generate synthetic flood hydrograph profiles along a river network at 30 arc second resolution (~1 km). However, instead of using flood elevation and simple basin fill models to simulate flood extents, the JRC model uses a two-dimensional hydraulic model and full channel depth estimates to simulate variable flow conditions and routing along river stretches. Flood extents are established using 3 arc second STRM digital elevation data (~90m resolution) with a consideration for the effects of terrain roughness.
A final distinction is the degree to which the JRC model has been tested and validated using comparisons against official flood hazard maps for selected areas (e.g., Europe, Africa, South America and Asia), comparisons against satellite-derived global flood maps and benchmarking studies that compare overall performance of flood hazard predictions against other modeling frameworks. Results indicate that the JRC framework performs well against other global and national flood hazard models, particularly in regions of Europe where the predicted flood extents match areas of observed flooding with a success ratio of 0.83 (Dottori, Salamon, et al. 2016). The JRC framework also performs well against the 90m resolution SSBN global flood hazard model for larger river networks with an upstream drainage area larger than 5,000 kilometres (Trigg et al. 2016).
Susceptibility to Flooding
Relationships between the estimated depth of flood water at a given location and the potential for negative impacts to buildings and other assets of concern are established through the use of depth-damage functions. While depth-damage functions do exist for localized flood hazard assessment studies across Canada, there is not, as yet, a harmonized set of functions for use at a national scale. In the interim, we are using outputs of global flood depth-damage functions that have been generated for representative building types in North America to assess overall levels of susceptibility(Huizinga, Moel, and Szewczyk 2017).
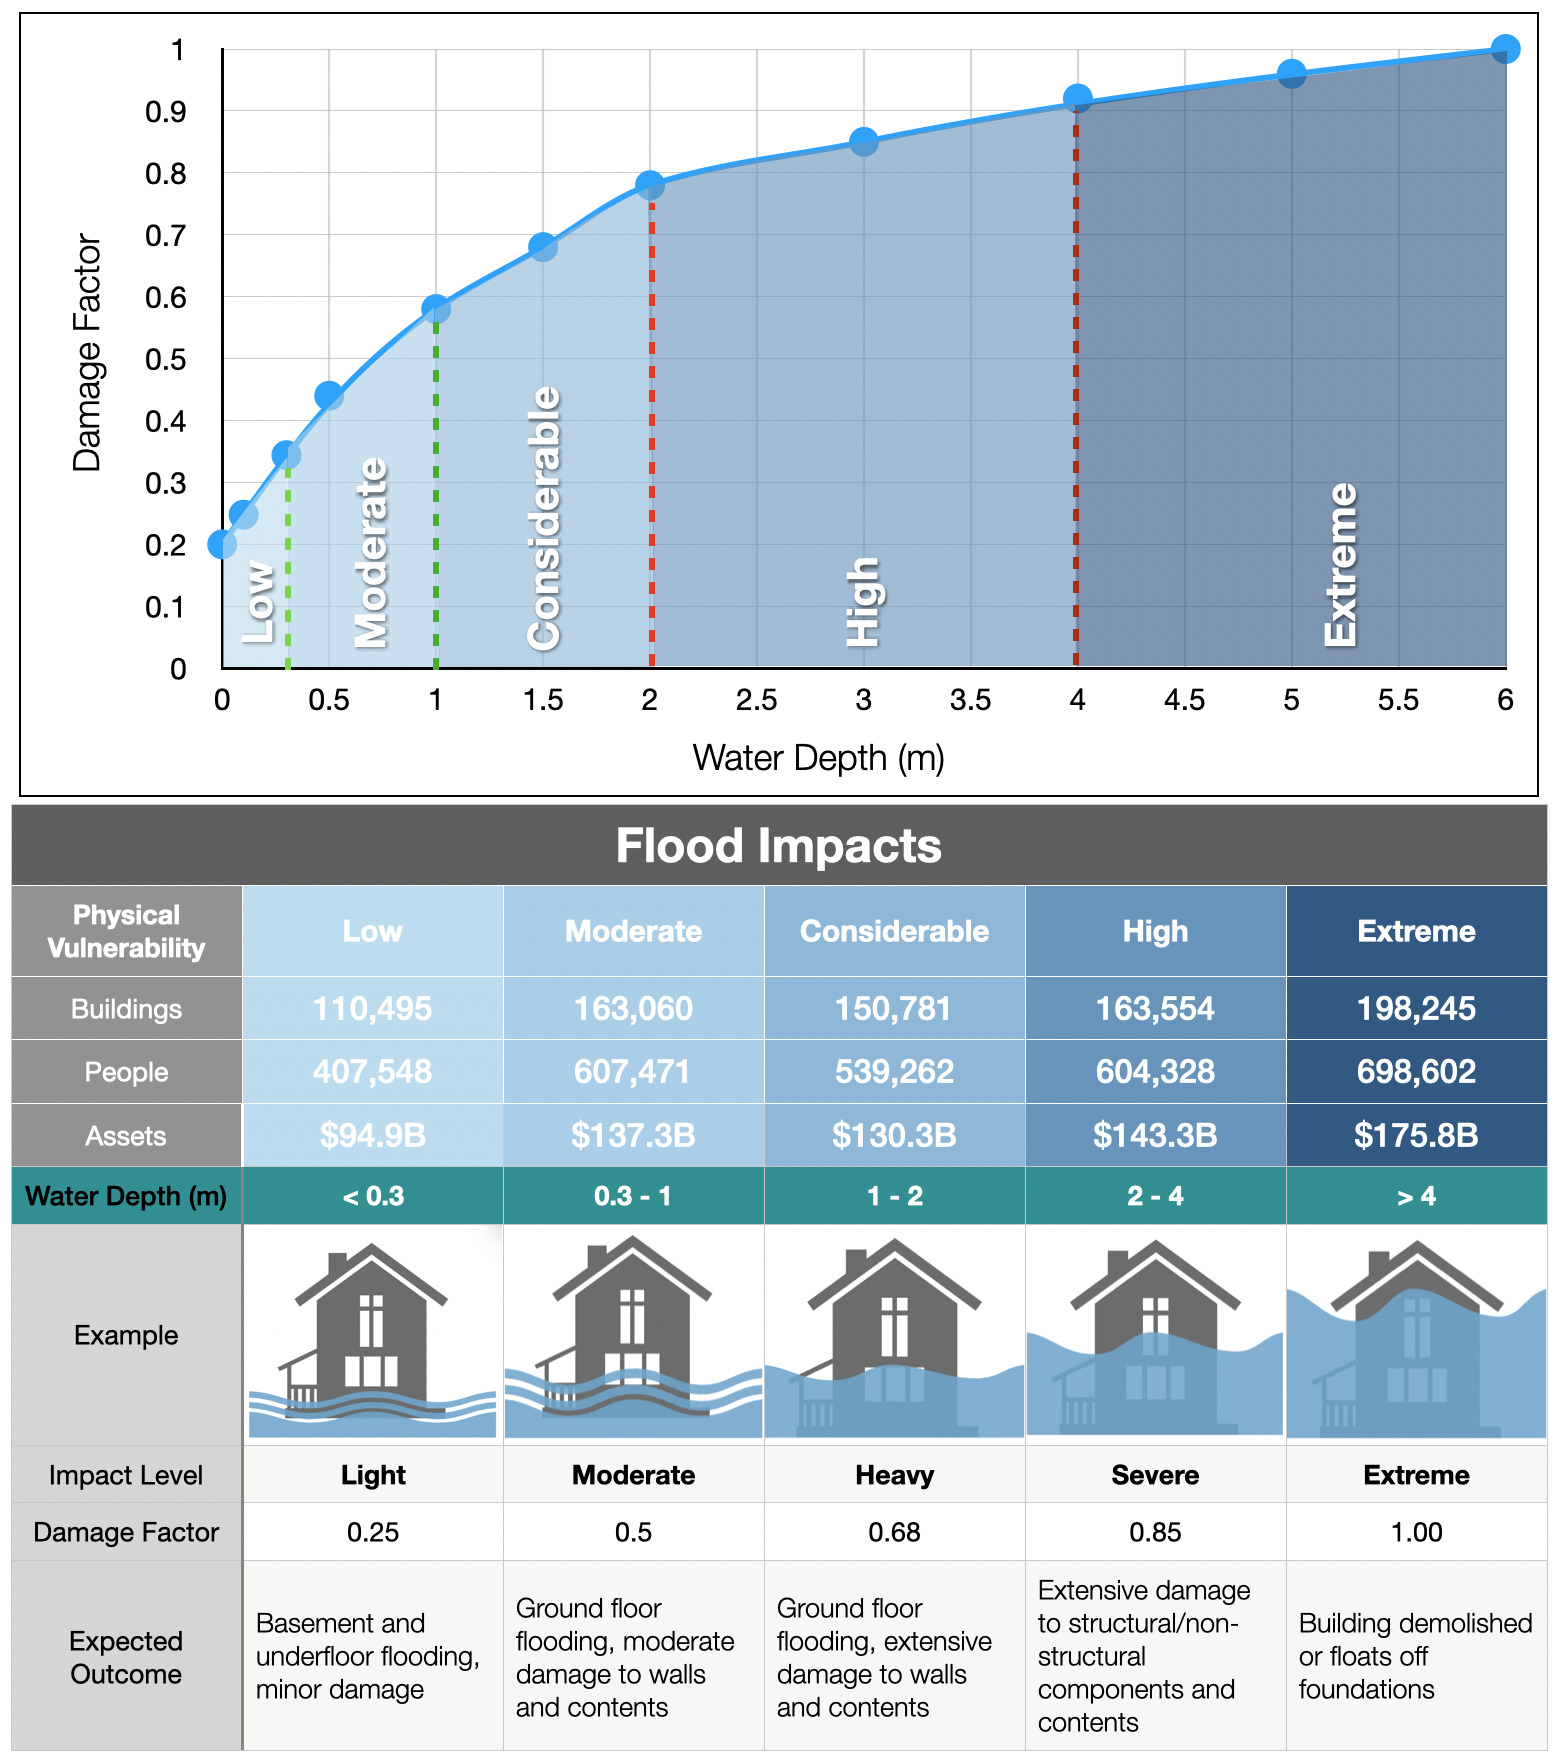
North American depth-damage functions are based on models initially developed as part of the HAZUS flood module to support quantitative assessments of damage and loss in the United States (Scawthorn, Blais, et al. 2006; Scawthorn, Flores, et al. 2006); and on comparable regional models developed to support floodplain management for selected regions in Canada. These models have been integrated to derive average depth-damage functions that are appropriate for assessing impacts to aggregate building portfolios at regional and national scales (Huizinga, Moel, and Szewczyk 2017). As illustrated in Figure 28, the potential for flood related impacts is assessed using hazard intensity thresholds that relate depth of water to expected levels of building damage (Blong 2003b; Klein, Greiving, and Jarva 2006; Delmonaco, Margottini, and Spizzichino 2007).
Unlike comparable damage curves used for threat assessment in a European context, average North American functions have a positive damage factor at water depths of only a few centimetres. This modification reflects the prevalence of finished basement areas in North American residential buildings where shallow overland flooding can result in significant levels of damage and loss to assets below grade. Even a few centimetres of flooding can result in repair costs in excess of 30,000 $CAD for an average 2,500 square foot home with finished basement areas (National Flood Insurance Program 2018). The aggregate costs of flooding across broad regions impacted by shallow overland flooding can be significant (Moudrak et al. 2018).
Flood susceptibility is described through the lens of hazard intensity thresholds corresponding to 5 levels of potential damage (Figure 28). Assets that are exposed to water depths of 30 centimetres or less are assigned a ‘low’ damage level that reflects potential impacts ranging from 20-34% of overall replacement value. Buildings exposed to flood depths of up to 1 metre are susceptible to moderate damage to walls and contents with corresponding impact levels of 34-58%. This level of flooding does not pose an immediate threat to safety but can result in significant social disruption and business interruption. More severe floods with water depths between one and two metres can result in ground floor flooding and ‘considerable’ damage to both walls and contents with impact potential of between 58-78%. Buildings in these areas would not likely be judged as ‘safe for the use intended’ by local authorities resulting in both household displacement and business interruption for periods of weeks and/or months. Damage and loss potential for extreme flood conditions of more than 2 metres of water reflects complete inundation with extensive structural and non-structural damage to buildings and contents. Depending on flow velocity and the presence of debris, these levels of flooding can represent a threat to public safety and result in ‘high’ and ‘extreme’ damage and financial loss that strain capacities to both withstand and recover in the months and years following the event.
Flood Threat
Evaluating hazard threats for geographically constrained natural processes like river floods and debris flows is challenging at a national scale due to uncertainties in both the spatial extent and depth of flood water at any particular geographic location; and the spatial distribution of people and critical assets within inundated areas for which building footprint information is not yet readily available. For these reasons, outputs of our flood threat assessment are considered valid for situational awareness at community and regional scales but should not be used for site-level planning.
Our assessment of potential flood impacts for Canada is based on results for both the UNEP and JRC global models (~1km resolution) and aggregated physical exposure information for settled areas derived from block-level census enumeration data (Figure 29). Spatial extents of settled area polygons roughly correspond with census dissemination areas in dense urban settings and range from less than 1 square kilometer to several square kilometres in settled area patchworks that define most urban fringe areas. Sparse settlements in rural and remote settings are represented by polygons of ~0.5 square kilometres or less that are defined by spatial buffering of individual buildings and/or clusters of buildings.
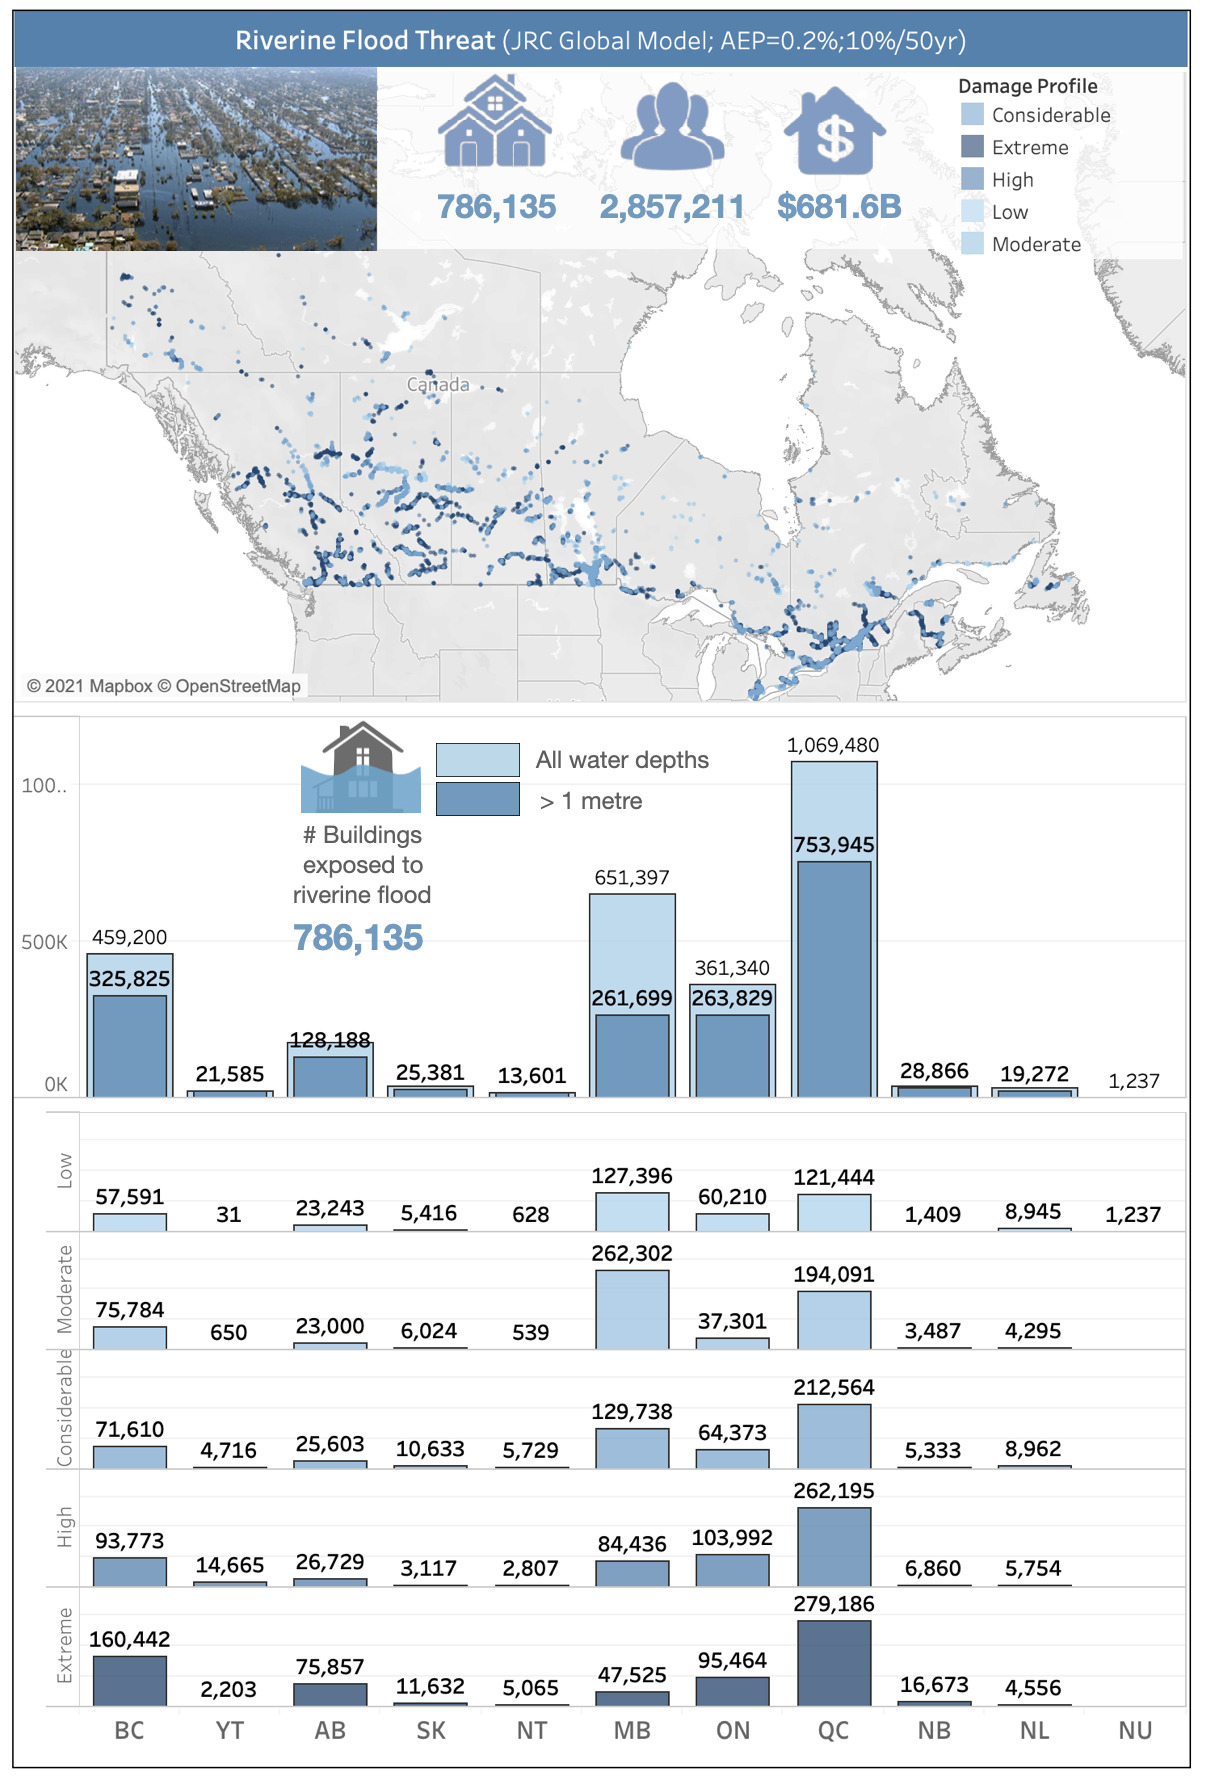
Mean water depths and corresponding damage levels are calculated for each settled area based on spatial overlap with the UNEP and JRC flood hazard models. The numbers of people, buildings and financial assets exposed to each of the five flood damage levels are then used to evaluate comparative profiles of hazard threat. Results of our analysis show significant differences when using the UNEP and JRC models to assess flood hazard threat, both in terms of overall physical exposure and profiles of damage potential at local and regional scales (Figure 29).
The number of buildings exposed to all levels of riverine flooding in the UNEP model is ~2.04M which corresponds with 6.7 million people (19% of population) and ~1,758B $CAD in financial assets. The equivalent profile of building exposure using intensity measures from the JRC model is ~786,135, which corresponds with 2.9 million people (7.6% of population) and ~682B $CAD in financial assets. An independent study reports 2.23 million people (6.3% of population) exposed to all levels of flooding using a comparable global flood model and census data (Mohanty and Simonovic 2021).
Variations in overall flood impacts based on the UNEP and JRC models reflect fundamental differences in the analytic methods used to estimate both discharge rates along river networks and the spatial extent of associated flooding. The UNEP model uses representative river discharge profiles based on a geographically sparse mesh of river flow stations to simulate the extent and depth of flooding in drainage basins of all sizes using a simple 1-dimensional basin fill model. The resulting hazard maps reflect a broader scope of flood potential in smaller drainage basins across Canada. However, the overall accuracy of flood extent and depth estimates is relatively low when compared with official flood plain maps and observations of recent flood events documented using remote sensing techniques (Natural Resources Canada 2021).
In contrast, the JRC global flood model makes use of a fully integrated network of climate-based river discharge and routing models and more refined estimates of flood extent based on 2-dimmensional hydrodynamic models. A limitation of the JRC model is that only reflects flood hazard potential for major river networks with an upstream drainage area larger than 5,000 kilometres. However, estimates of flood extent for these larger drainage systems are more accurate when compared with both detailed regional flood hazard maps and recent historic events. In general, the JRC model also predicts higher levels of flood inundation across all return periods, likely a result of using full channel depth in a two-dimensional hydraulic model rather than mean channel surface heights derived from a digital elevation model alone. This has important implications when considering thresholds of damage potential within a particular community or region. On the basis of these observations, we consider the JRC model to be more suitable for assessing damage potential for severe flood events that are likely to be of concern for an AEP of 0.2% (10% in 50-year events).
Hotspots of elevated damage potential identified using the JRC hazard model known are consistent with locations of severe flood events that have occurred along the Bow River in southern Alberta, the Fraser River system in southwestern British Columbia, the Red and Souris Rivers in Manitoba, the Ottawa River and St. Lawrence Seaway region of Ontario and Quebec, and the Saint John River in New Brunswick. Comparisons between predicted and observed flood hazards in these regions (Figure X) show good correlations both in terms of flood extent and depth of inundation. Mismatches between predicted and observed areas of flooding are primarily along secondary drainage systems that are not captured in the JRC model. These observations indicate that the JRC model is likely under-estimating overall flood damage along the confluence of major and minor river networks, and in regions across Canada where the effects of flooding in smaller drainage systems are not captured in the modeling process.
The final step in our assessment of flood threat is the integration of damage potential with characteristics of the built environment that will determine the overall severity of future flood events. Outputs are used to generate a bivariate map of flood threat for all settled areas in Canada. The maps and accompanying summary statistics help make evident cause-effect relationships and how specific interactions between flood hazards and physical exposure vary spatially from one geographic location to another. Representative maps and summary charts for metropolitan regions that are exposed to higher levels of flood threat are shown in Figure 30.
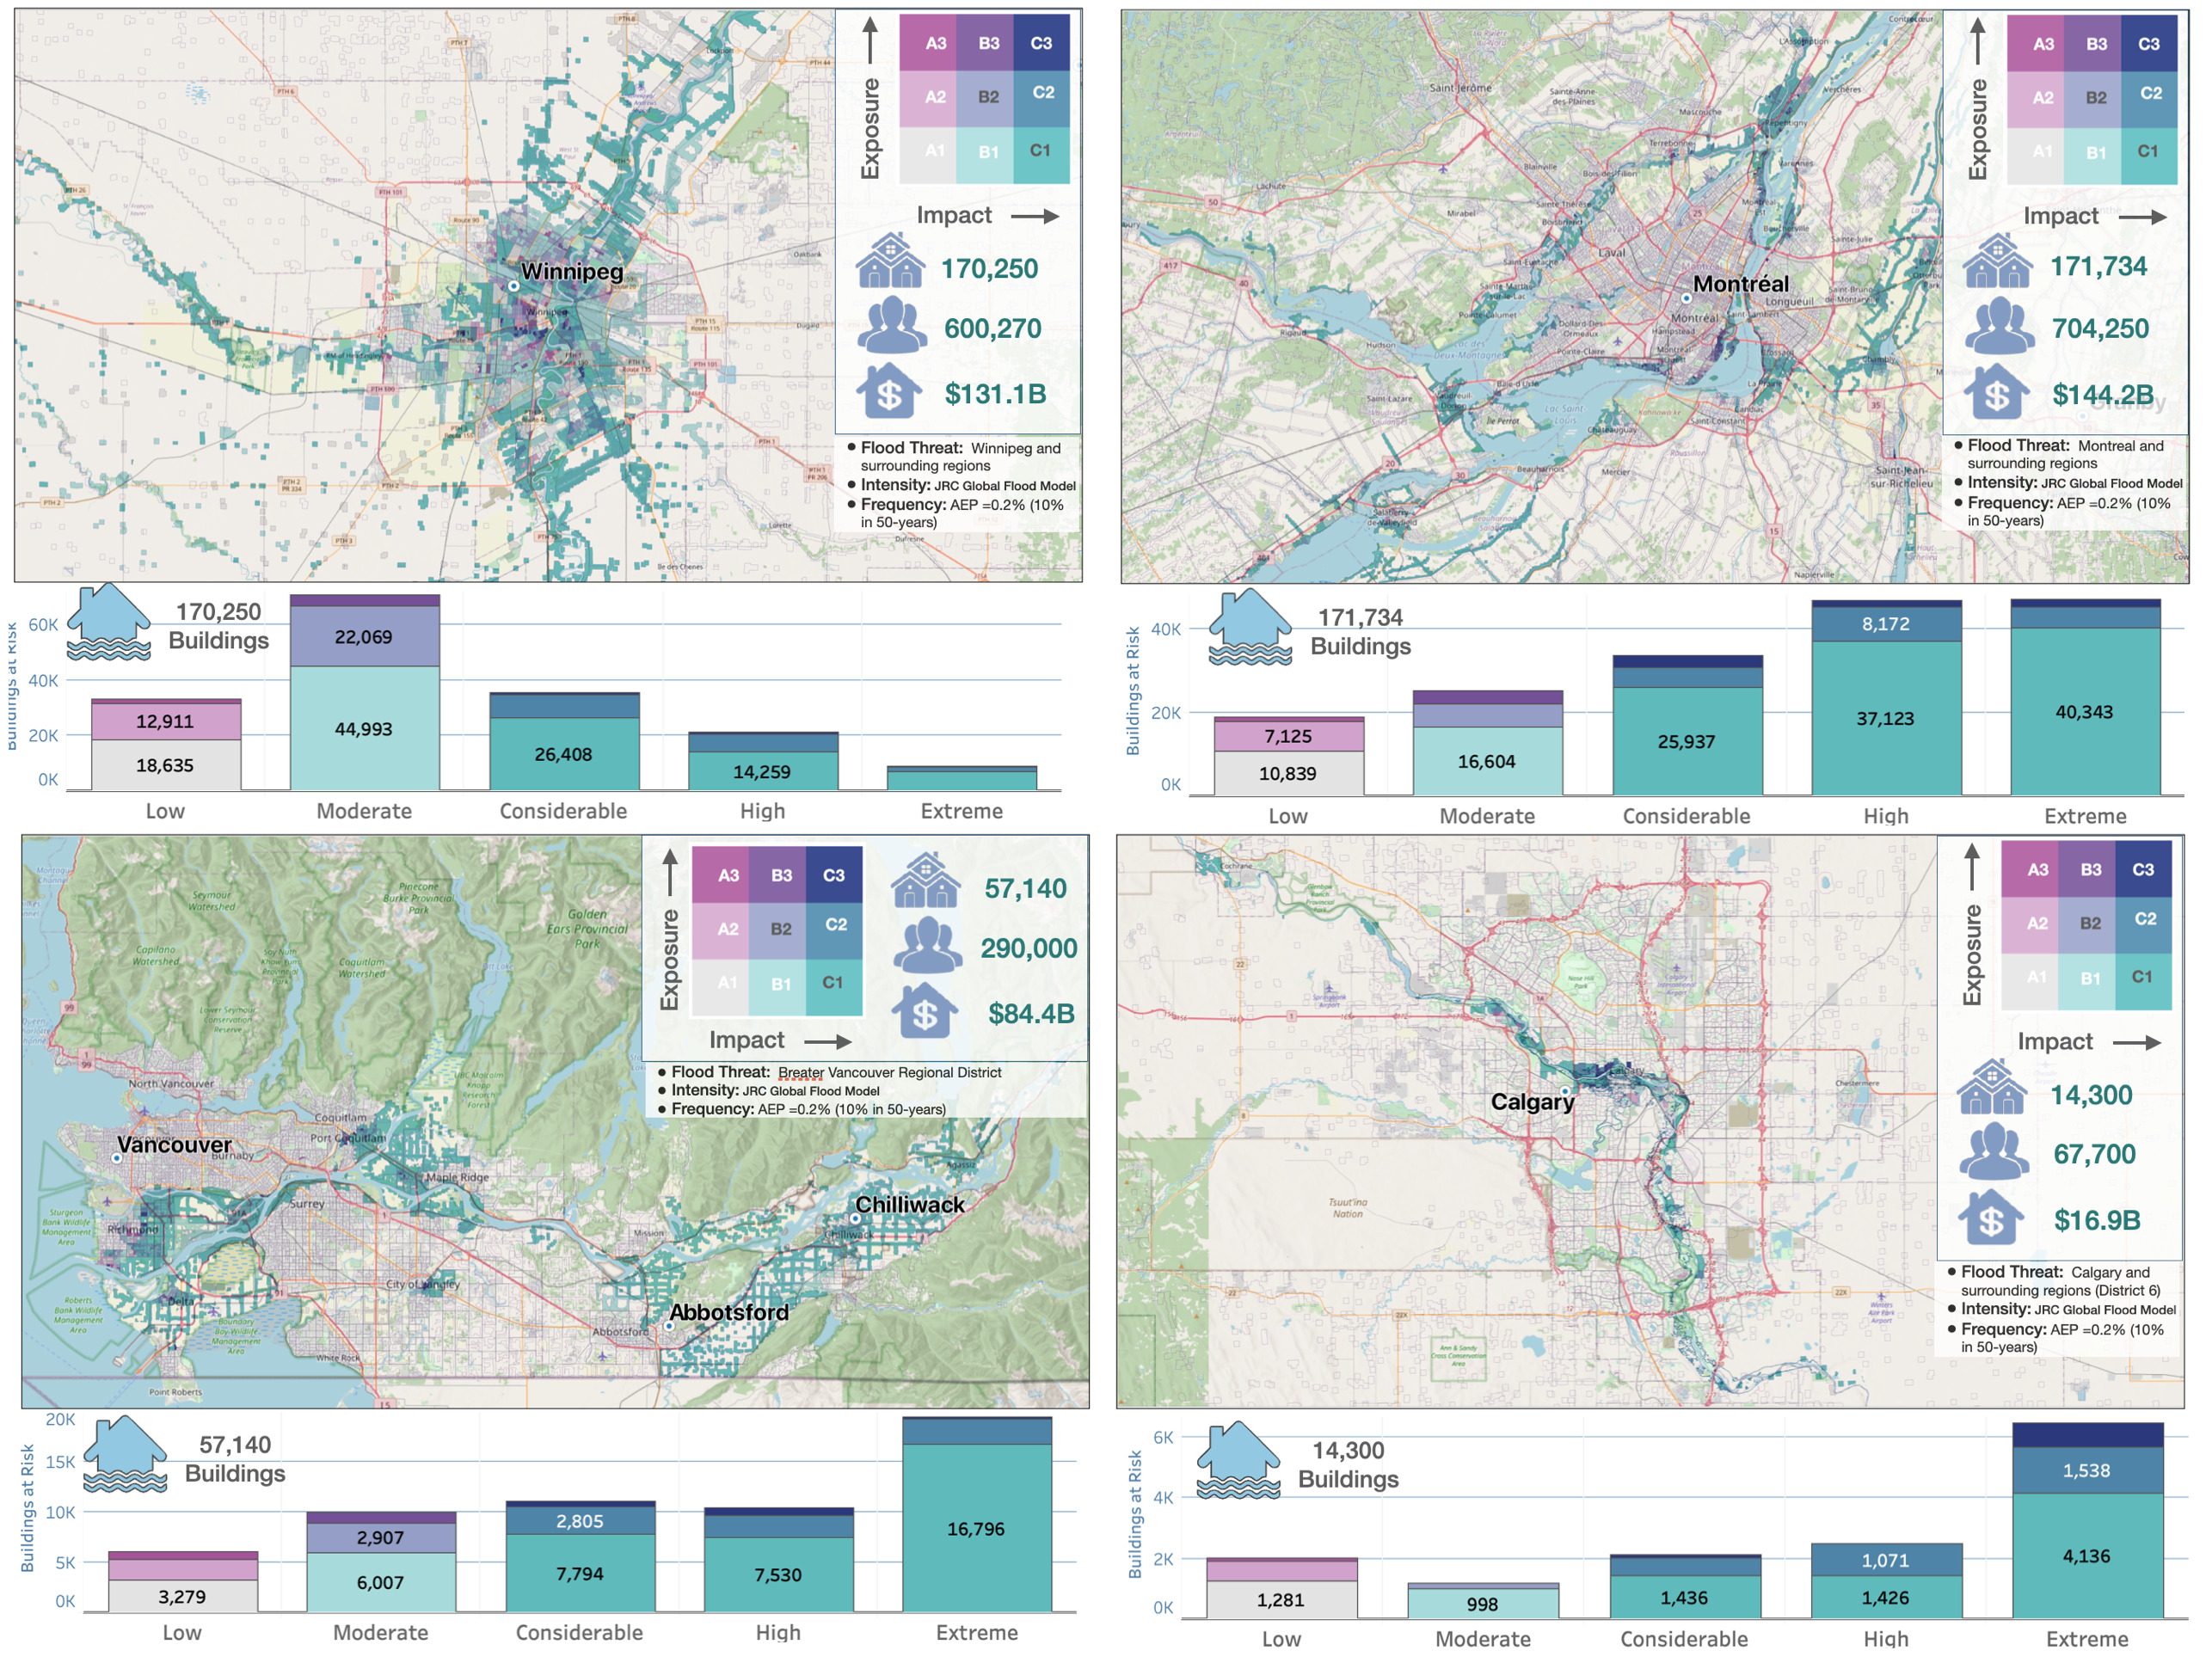
As discussed in earlier sections, global flood hazard models do not have a sufficient scale of resolution or information about local flood protection measures to predict detailed patterns of water flow or inundation (Trigg et al. 2016). Nonetheless, they do provide a worst-case scenario for assessing overall susceptibility to flood impacts resulting from overtopping and/or structural failure of existing flood protection measures designed for smaller event magnitudes (AEP of 0.5%-1%). For example, Winnipeg and surrounding regions of southern Manitoba are protected by an extensive system of flood control measures including community diking along the Red River; the Red River Floodway – a 47-kilometer channel constructed to divert part of the Red River’s flow around the city of Winnipeg; the Portage diversion and Shellmouth Dam on the Assiniboine River, and primary diking systems within the City of Winnipeg itself. Although designed to withstand water volumes similar to those experienced earlier in the century, these measures were partly overwhelmed in 1997 during a severe storm event resulting in extensive flooding over a region of ~2,000 square kilometres, the evacuation of more than 20,000 people and economic losses of several hundred million dollars.
Model Validation
The Winnipeg flood scenario shown in Figure X is based on 10% in 50-year flood hazard (AEP = 0.2%). Resulting river flows for severe events that are possible within this time horizon would likely exceed current carrying capacities of protective measures. Primary vulnerabilities include structural measures that are not currently designed to manage higher volumes of water during sudden and severe storm events, networks of roads, rail and other infrastructure development on adjacent floodplains that can inhibit natural patterns of overland flow, and the potential for structural failure of flood protection measures at several critical points along the network (Simonovic and Carson 2003). Areas of susceptibility shown in Figure 30A include settlements along primary and secondary river channels and dense urban neighbourhoods surrounding the confluence of Red and Assiniboine Rivers and downstream reaches. While it is unlikely that all regions shown on the map would be flooded during a single event, the patterns of flood threat do highlight regions of primary concern hazard susceptibility and exposure ratings are both high. The majority of damage potential is concentrated in low-density neighbourhoods surrounding Winnipeg with concentrated pockets of flood threat in the downtown core. As noted elsewhere in this study (See Section X.X), areas of highest flood threat also coincide with regions of the city with relatively high levels of social vulnerability.
The overall scope of flood threat is similar along portions of the St. Lawrence River near its confluence with the Ottawa River and along downstream sections pass through Laval, Montreal, Longueil, l’Assomption and adjacent stretches along the Richelieu River (Figure 30B). Many of these areas have experienced recent flooding and are susceptible to the impacts of more severe events that are likely in a 10%/50-year scenario. Although the total area of land exposed to inundation hazards is less than in the Winnipeg example, the level of susceptibility is higher overall due to a higher concentration of medium and high-density urban neighbourhoods in the broader metropolitan area. Interactions between flood hazards and the built environment result in a 10-15% increase in the number of people and financial assets that are susceptible to the impacts of riverine flooding (10-15%).
iamge::media/image10.jpg[image,width=664,height=661,align="center"]
The Lower Fraser River has been the site of massive flood events in the past and continues to pose a significant threat to large and small communities along lower reaches of the Fraser delta, which includes the metropolitan region of Greater Vancouver (Figure 30C). Catastrophic outburst flood events dating back to post-glacial times are documented in the geologic record (Clague et al. 2021). They are also are imprinted in the oral histories of indigenous communities living along the Fraser Canyon and low-lying areas of the Fraser Delta and Salish Sea where geomorphic evidence of scoured valley bottoms are a testament to the volume and force of flood waters that would have destroyed everything in their path (Clague et al. 2021). Since European settlement, the Fraser Valley and other parts of the Fraser Basin have experienced two major flood events and seasonal flood hazards during Spring freshets. The largest of these historic flood events occurred in 1894 and 1948. While there is an extensive system of dikes, flood boxes and pump stations in place to mitigate the impacts of future severe flood events, there is potential for failure of protective measures at key locations that would result in large scale flooding in densely populated urban centres situated along the valley bottom.
As with the Winnipeg flood scenario, many of the flood control measures are designed to withstand flow volumes and water depths commensurate with extrapolated historic peak flow and high-water marks from major historic events in 1894 and 1948. Hydraulic modeling carried out as part of the Lower Mainland Flood Management Study show that future severe flood events would be up to 1 metre higher that existing dike elevations, assuming that flood flows are confined by the dike system (Fraser Basin Council 2016; Menezes and North 2016). Modeling of overall vulnerability to severe flooding associated with a 0.2% AEP event (10%/50 year) indicates that over 9,200 buildings would be damaged with ~1,700 completely destroyed and a potential for more than 311,000 people to be displaced.
Failure of key dike infrastructure at upstream locations would result in extensive flooding in Chilliwack, Abbotsford, Pitt Meadows, New Westminster, Richmond and Delta. Flood threats shown in Figure X assume failure of existing structural protection measures and provide an overall assessment of additional susceptibilities to a major flood event in the Lower Fraser Valley. Flood threat is distributed across all five damage states with a large number of buildings susceptible to high water levels and extreme damage potential – similar to that observed in the greater Montreal region. Threat is concentrated primarily in low-density residential and agricultural areas throughout the Fraser Valley, and in pockets of medium and high-density residential and commercial neighbourhoods in several of the larger urban centres that make up the Greater Vancouver Regional District. Additional modeling of flood risk in the Lower Fraser Lowland that considers the potential for dike failure is currently in progress and will provide a much more robust and complete assessment of potential future impacts.
The Calgary Flood of 2013 was triggered by severe storms and sustained heavy rainfall on a melting snowpack in steep mountainous terrain along the eastern slopes of the Rocky Mountains (Figure 30D). The resulting runoff was channeled down tributaries of the Bow River resulting in heavy flooding in downstream settlements and in densely populated residential neighbourhoods and downtown business districts in the City of Calgary (Teufel et al. 2017). The largest single event since 1932 and one of the most severe and costliest flood disasters on record, the 2013 Calgary flood event resulted in five deaths, the disruption of more than 110,000 people and economic losses of more than 6 billion $CAD. It is estimated that overall severity of the flood was equivalent to that of a ~2.5% AEP event (Pomeroy, Stewart, and Whitfield 2016).
The flood threat scenario shown in Figure X is based on a 0.2% AEP hazard profile generated as part of the JRC global model. Although the spatial resolution is relatively coarse (~1km), the modeled extent of flood inundation matches that of the 2013 flood event reasonably well but extends further in both upstream and downstream directions. In addition to impacting a larger geographic area overall, the 0.2% AEP event also results in broader areas of inundation in northwest portions of the city centre. Resulting patterns of hazard threat show more than 14,300 buildings exposed to flood inundation with concentrations of high and extreme damage potential in both medium and high-density residential neighbourhoods and commercial districts within the city centre.
While the methods described here provide an overall assessment of hazard threat, more refined risk assessment studies that include the physical vulnerabilities of specific building types would yield a very different profile of expected impacts and downstream consequences. Nonetheless, results of our flood threat assessment provide a capability to identify hotspot areas of concern for severe flood events along major river systems in Canada but should not be used for local planning or land use decision making at a neighbourhood scale. For example, they do not reflect more frequent flood hazards within smaller drainage basins that will be of concern to many communities in mountainous regions of western Canada. Nor do they reflect extensive flood protection measures that have been put in place in larger urban centres to mitigate the risks associated with development on active flood plains with a potential to experience severe flood events. Nonetheless, outputs of the model do provide a positive test of the overall hazard threat assessment methodology developed as part of this study and offer a reference for future studies that incorporate higher resolution flood hazard models and site-level building inventories to assess detailed patterns of flood risk that will be required for sustainable land use and disaster risk reduction planning.
Wildfire
As with rivers and floods, forests and wildfire are a defining characteristic of the Canadian landscape (Figure 31). Wildfire in Canada is both an agent of forest renewal and a threat to people and critical assets situated along the wildland-urban-interface (WUI). The underlying natural processes provide important opportunities for sustainable land use and community development, yet have the potential to cause significant damage, financial loss and social disruption for human settlements situated in harm’s way.
Forests, wooded landscapes and grasslands cover nearly half the landmass of Canada. They are susceptible to ignitions by lightning strikes and human causes that can result in conflagration and the burning of large regions. Indigenous peoples and early European settlers used fire to manage ecosystem health and to clear land for development. The 1916 Matheson wildfire in northeastern Ontario burned 24 townships, killing at least 243 people and destroying a number of small towns in its path (Etkin 2010). It was one of three major events over a period of just eleven years (1911-1922) that demonstrated an urgent need for organized fire protection in Canada.
The occurrence of significant wildfire events (>200 hectares) declined after this initial sequence of events with a significant trend reversal in the late 1950’s that has resulted in a steady increase in the number of large fires in the last fifty years (Stocks et al. 2002). Records show that the frequency of wildfire occurrences has increased steadily to an annual rate of ~8,000 fires burning more than 2.5 million hectares of forest in any given year (CIFFC 2019). The number and severity of significant wildfire events is a function of seasonal fluctuations in weather conditions superimposed and longer-term trends linked to the influences of human activities that have resulted in alterations to land cover and global patterns of climate change (Flannigan et al. 2009).
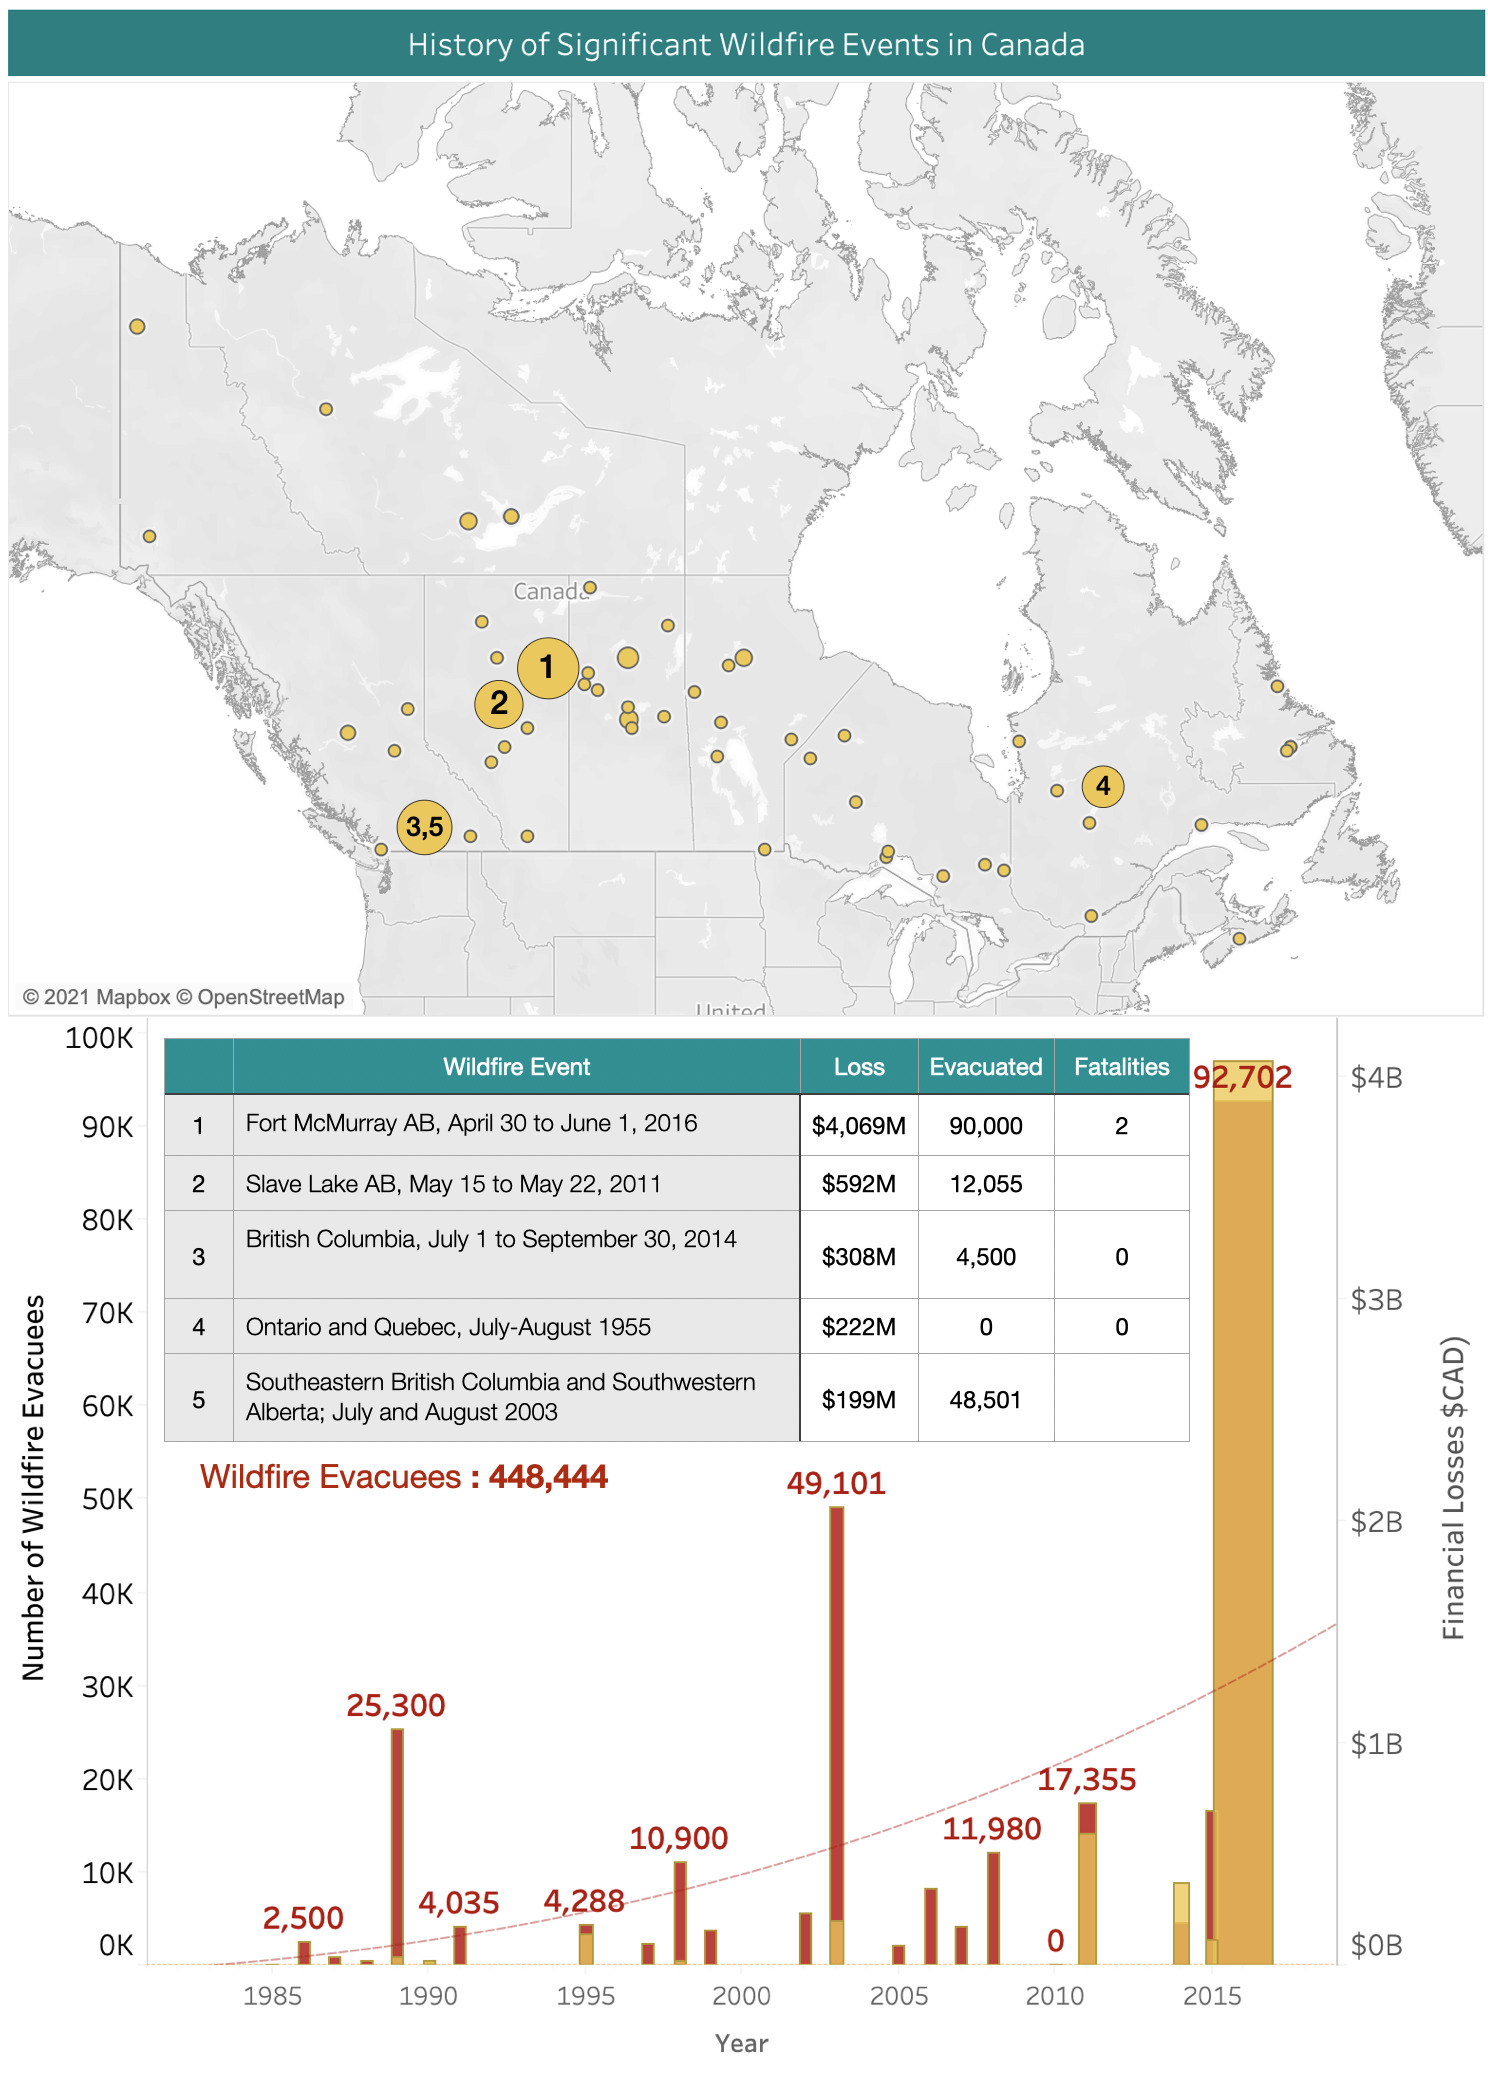
The negative impacts of wildland fires are well-known and have left their mark on communities across Canada (Figure 32). Updated Information from the Canadian wildfire evacuation database indicate that nearly 450,000 people were forced from their homes and businesses in the period between 1980 and 2007 (Beverly and Bothwell 2011). Major events along the wildland-urban-interface in the Okanagan region of southern British Columbia in 2003 and again in 2017 resulted in the evacuation of ~77,000 people. Mass evacuation of ~12,000 from the community of Slave Lake occurred in 2011. By far the most significant wildfire disaster in Canadian history was the 2016 Fort McMurray wildfire, which destroyed more than 2,500 homes and forced the evacuation of ~92,700 people (Mamuji and Rozdilsky 2019; Public Safety Canada 2021). Insured losses over this period exceed 5 billion $CAD with indirect economic losses likely to have been even higher (Swiss Re 2019). While these events are significant in terms of Canada’s national profile of disaster risk, it is the potential of future firestorm events similar in magnitude to those experienced along the wildland-urban-interface in California and Australia that are of greatest concern.
There is a large body of knowledge and expertise in Canada about the causes and behaviour of wildfire hazards on the landscape, and frameworks in place to support operational wildfire management, including all aspects of pre-event planning, mitigation, response and decision support (Hirsch and Fuglem 2006). Our focus here is on the interactions between wildfire and human settlements in both urban and rural/remote settings, and the relative threat of negative impacts in comparison with other hazards of concern in Canada. Wildfire threat is an issue not only along the interface with urban centres, but also in rural and remote settings where there is an increased demand for recreational property and shifts in lifestyle that are drawing people and assets to settlements in areas of elevated wildfire hazard. Our work builds on existing studies of wildfire hazard and exposure along the wildland-urban-interface (Peter et al. 2006; Beverly et al. 2010; Johnston and Flannigan 2018), and contributes to ongoing efforts to establish a national framework for quantitatively assessing wildfire risk to support the prioritization of prevention, preparedness, mitigation and risk transfer measures aimed at minimizing the negative impacts of future disaster events in Canada (Swiss Re 2019; Johnston et al. 2020).
Wildfire Hazards
Wildfire hazards reflect dynamic interactions between a wide range of environmental factors, including the availability and condition of forest fuel materials, weather and atmospheric conditions, topography and potential sources of ignition. The Canadian Forest Service utilizes this information to predict spatial and temporal patterns of wildland fire behavior to support operational wildfire management across all regions in Canada. The Canadian Forest Fire Danger Rating System provides an integrated assessment of overall wildfire hazard potential (Stocks et al. 1989; Alexander, Stocks, and Lawson 1996). It is based on inputs from the Fire Behaviour Index (FBI), which measures ignition potential, fuel availability and landscape variables that determine the intensity and capacity of a forest fire to spread over the landscape (Taylor and Alexander 2018; Hirsch 1996; Wotton, Alexander, and Taylor 2009); and the Fire Weather Index (FWI), which monitors evolving atmospheric and weather conditions (wind, temperature and precipitation) that will influence both the intensity and spatial patterns of spread on a daily and seasonal basis (Van Wagner 1987; Wotton, Alexander, and Taylor 2009).
Wildfire hazards considered in this study are based on 30-year mean estimates of head fire intensity for peak periods of the wildfire season. Head fire intensity is a component of the Fire Behaviour Index and is defined as the rate of energy or heat released per metre at the frontal edge of an advancing fire (Byram 1959). It is numerically equivalent to the product of available fuel energy and the rate of fire advance over the landscape. It is measured in units of kilowatts per metre (kW/m) and is used to supplement local knowledge and the expertise of wildfire management organizations in assessing the potential physical impacts of a wildfire on people and critical assets that may be in harm’s way (Alexander 1982). In addition to predicting the heat energy released from burning fuels as the fire spreads, head fire intensity also provides an indirect measure of flame height and the potential for remote ignition of vegetation and/or assets of concern from firebrands (e.g., falling embers) propelled along the frontal edge of the wildfire (Maranghides and Mell 2013).
The wildland fire interface (WFI) is a delineation of hazard source zones that pose the greatest threat to human settlements and critical infrastructure (Johnston and Flannigan 2018). Primary wildfire source zones are identified on the basis of fuels types and fire behaviour characteristics using a variable distance buffer to delineate both the spatial extent of burnable land and relative hazard potential. Narrow buffers represent areas of the wildfire source zone in which there are low volumes of wildland fuels and limited potential for conflagration of large fires. Broader zones extending up to a maximum distance of 2400 metres represent areas of increased hazard potential where large fires with a potential to spread are likely to occur. Based on this analysis, it is estimated there are ~115 million hectares of burnable wildland that could pose a threat to buildings, people and critical infrastructure. This represents ~14% of the total land area in Canada (~840M ha) and over 20% of the total wildland fuel area in Canada (Johnston and Flannigan 2018). The estimate includes 32.3 million hectares adjacent to settle populated places, 10.5 million hectares of industrial lands and over 109 million hectares of linear infrastructure (transportation, energy, water and communication) with some level of exposure to potential wildland fire hazards.
While details of wildfire hazard potential are well known and used on a routine basis to inform operational wildfire management activities, Canada does not yet have a capability to assess the probability of experiencing future wildfire events of a given intensity over variable time horizons for regions of concern across Canada (Wang et al. 2017; Swiss Re 2019; Johnston et al. 2020). This precludes both a direct comparison with other hazard threats reported in this study at AEP = 0.2%; (10% in 50-year event likelihood), and quantitative analysis of physical risk which measures the probability negative consequences (damage, loss, injury, etc.,) from all known hazard source zones for over a specified time interval. Nonetheless, available information does support a scenario-based approach for assessing regional patterns of wildfire threat based on a national framework of mean head fire intensity measures within a clearly defined wildland fire zone bordering human settlements and assets of concern.
Wildland-Urban-Interface
The wildland-urban-interface (WUI) is defined as the area within which physical assets of the built environment meet with or are dispersed within wildland vegetation, and are susceptible to ignition from wildfire hazards (USDA and USDI 2001). It can be sharply delineated along the boundary between the built environment and adjacent land cover containing wildland fuels capable of generating and sustaining a forest fire (interface); feathered across a transition zone in which engineered structures are intermixed with wildland fuels (mixed interface); or completely contained by a settled area where islands of vegetation occur within an area that has been cleared and developed for human activity (occluded interface; Davis 1988; Cohen 2008). The threats of wildfire to homes, businesses and critical infrastructure along this critical interface have been steadily increasing in North America. This is due in part to escalating growth pressures and the development of residential neighbourhoods in urban fringe areas along with limited coupling to building codes for new construction and/or FireSmart guidelines for the mitigation of existing buildings (Hirsch and Fuglem 2006).
In Canada, the WUI is incorporated into the broader wildland fire buffer, which represents the area of burnable land in proximity to human settlements and critical infrastructure corridors (Johnston and Flannigan 2018). For purposes of this study, we focus on the human settlement component of the WUI (USDA and USDI 2001), which measures the exposure and susceptibility of buildings to ignition from the surrounding wildland fire zone. This approach is aligned with mitigation guidelines established as part of the FireSmart Program in Canada (Partners in Protection 2003; Beverly et al. 2018) and with site-level wildfire threat assessments carried out in western Canada (Beverly et al. 2010). In this context, the WUI buffer is defined by the degree or level of exposure of the built environment to potential ignition sources within the burnable land cover.
Our approach is similar to that used to develop regional-level WUI maps at a national scale in the United States and benefits from insights gained thorough validation studies carried out as part of this work (Radeloff et al. 2005; Stewart et al. 2009; Platt 2010). Maps are based on granular census data that provide population counts and/or housing unit information at the block level. Our assessment takes the process one step further by assigning specific building types at each unique asset location and evaluating the corresponding number of people and capital assets that are exposed to wildfire threats based on a combination functional use and construction matreials (See Section X). To our knowledge, this may be the first attempt to implement an exposure-oriented delineation of the wildland-urban-interface at a national scale in Canada. Model outputs are intended to complement more detailed site-level studies that account for characteristics of land use and wildfire behaviour that will ultimately determine damage potential (Beverly et al. 2010).
While distinct in terms of conceptual framing, core elements of our assessment methodology are consistent with those used to develop the national wildland fire zone (Johnston and Flannigan 2018), and lead to a similar set of conclusions about relative levels of threat to people and critical assets. We use site-level building information from the CanVec+ dataset to identify mixed interface settlements within the broader WUI that are less than 5 square kilometres and exposed to hazard intensity values capable of causing damage (Natural Resources Canada 2017). Urban settlement boundaries that define the edges of wildland-urban-interface are identified using built-up areas extracted from a national 30 metre land cover dataset based on Landsat earth observation data (Agriculture and Agri-Foods Canada 2015; Natural Resources Canada 2015). WUI zones extending into urban settlements larger than 5 square kilometres are delineated using a multi-level buffer extending 500 metres inward from the outer edge of the settlement boundary.
The rationale for selecting variable 500 and 2400 metre buffers for urban and mixed interface settlements (respectively) is based on guidelines established for likely sources of ignition within the built environment (Long and Randall 2004; Quarles et al. 2010; Platt 2010; Beverly et al. 2010; Beverly et al. 2018). For example, assets within the innermost buffer zone that are exposed to head fire intensity values of ~2000 kW/m or greater (radiant heat) can result in the breakage of unhardened window glass and ignition of exposed structures and/or combustible material within distances of ~ 30 metres or less of the fire front (Maranghides and Mell 2013; Beverly et al. 2018).
Similarly, burning and/or smoldering embers propelled by wind generated along the advancing fire front (aka ‘firebrand’) can result in remote ignitions at distances of ~500 metres along well-delineated interface boundaries (Bierwagen 2005; Beverly et al. 2010), and distances of up to ~2400 metres in mixed interface settings where firebrand embers can travel much further under extreme conditions of wind that accompany large fires (USDA and USDI 2001; Johnston and Flannigan 2018). Forensic studies of large interface fires indicate that two out of every three homes are destroyed either directly or indirectly by burning or glowing embers carried by winds along the advancing fire front (Maranghides and Mell 2009; Quarles et al. 2010). Building assets within each of the buffer zones are selected for inclusion within the WUI based on mean head fire intensity values that reflect relative severity of hazard threat and the potential for structural damage and/or social disruption. Assets situated in buffer zones along the coastline and/or large inland lakes are filtered out of the final selection.
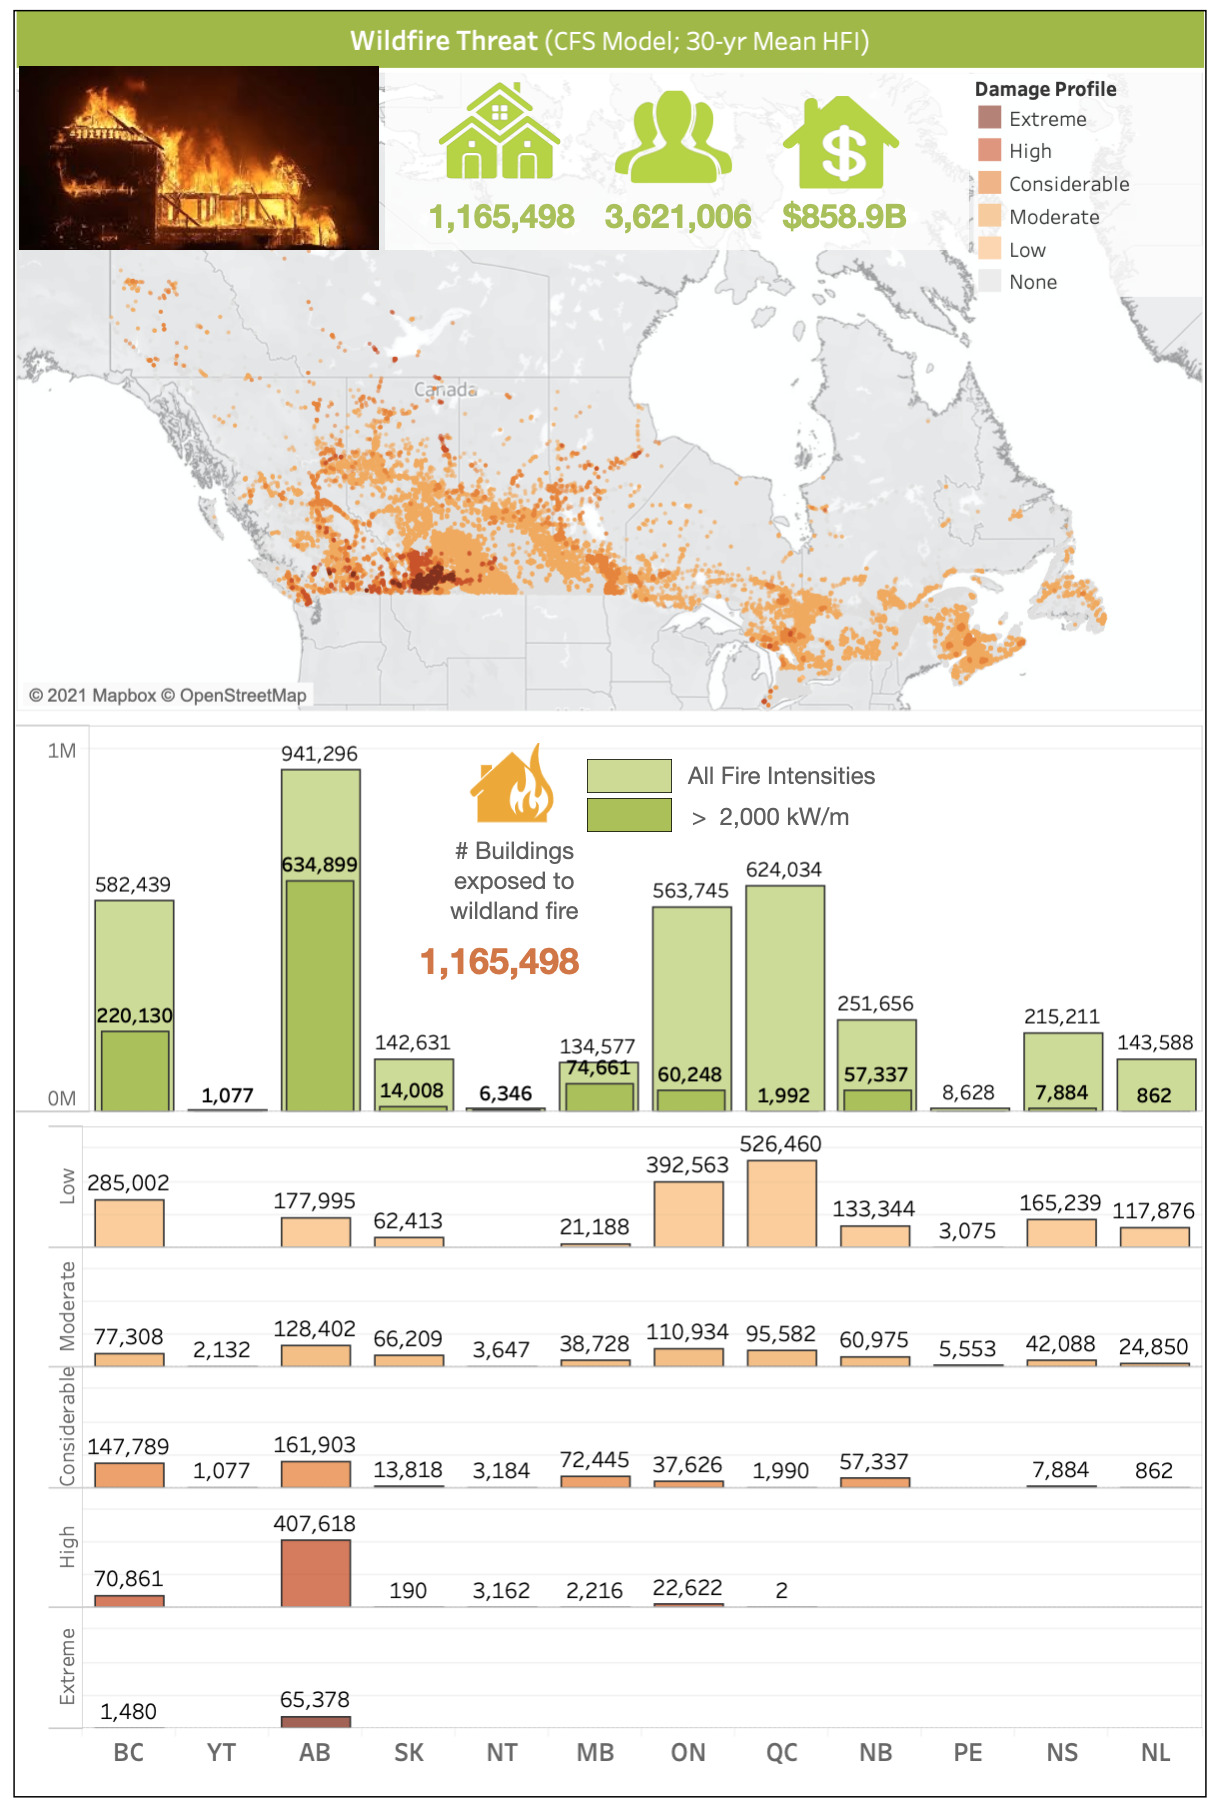
Outputs of our assessment indicate there are 64,800 asset locations representing ~1.97 million hectares of built-up areas within the wildland-urban-interface that are susceptible to ignition from burnable lands in the adjacent wildland fire zone (See Table X). In decreasing order, the largest concentrations of assets at risk are in Alberta, British Columbia, Ontario, Quebec and New Brunswick. The inventory of assets at risk includes 1.17 million buildings representing homes and businesses belonging to ~3.6 million people with capital assets totalling more than 858 billion $CAD.
Impact Assessment
Having established the overall exposure and susceptibility of homes and businesses to wildfire hazards, we then assess the potential for negative consequences based on established correlations between hazard intensity and expected damage to buildings from radiant heat and/or spotting from firebrand embers along the fire front (Figure 33). While advanced burn models do exist for predicting the behaviour of a wildfire once it has been ignited (Parisien et al. 2005), equivalent models of ignition potential and fire spread within the wildland-urban-interface are focused primarily on site-level assessments that require detailed knowledge about ignition and fire spread characteristics based on local land use and environmental conditions (Bardales et al. 2019).
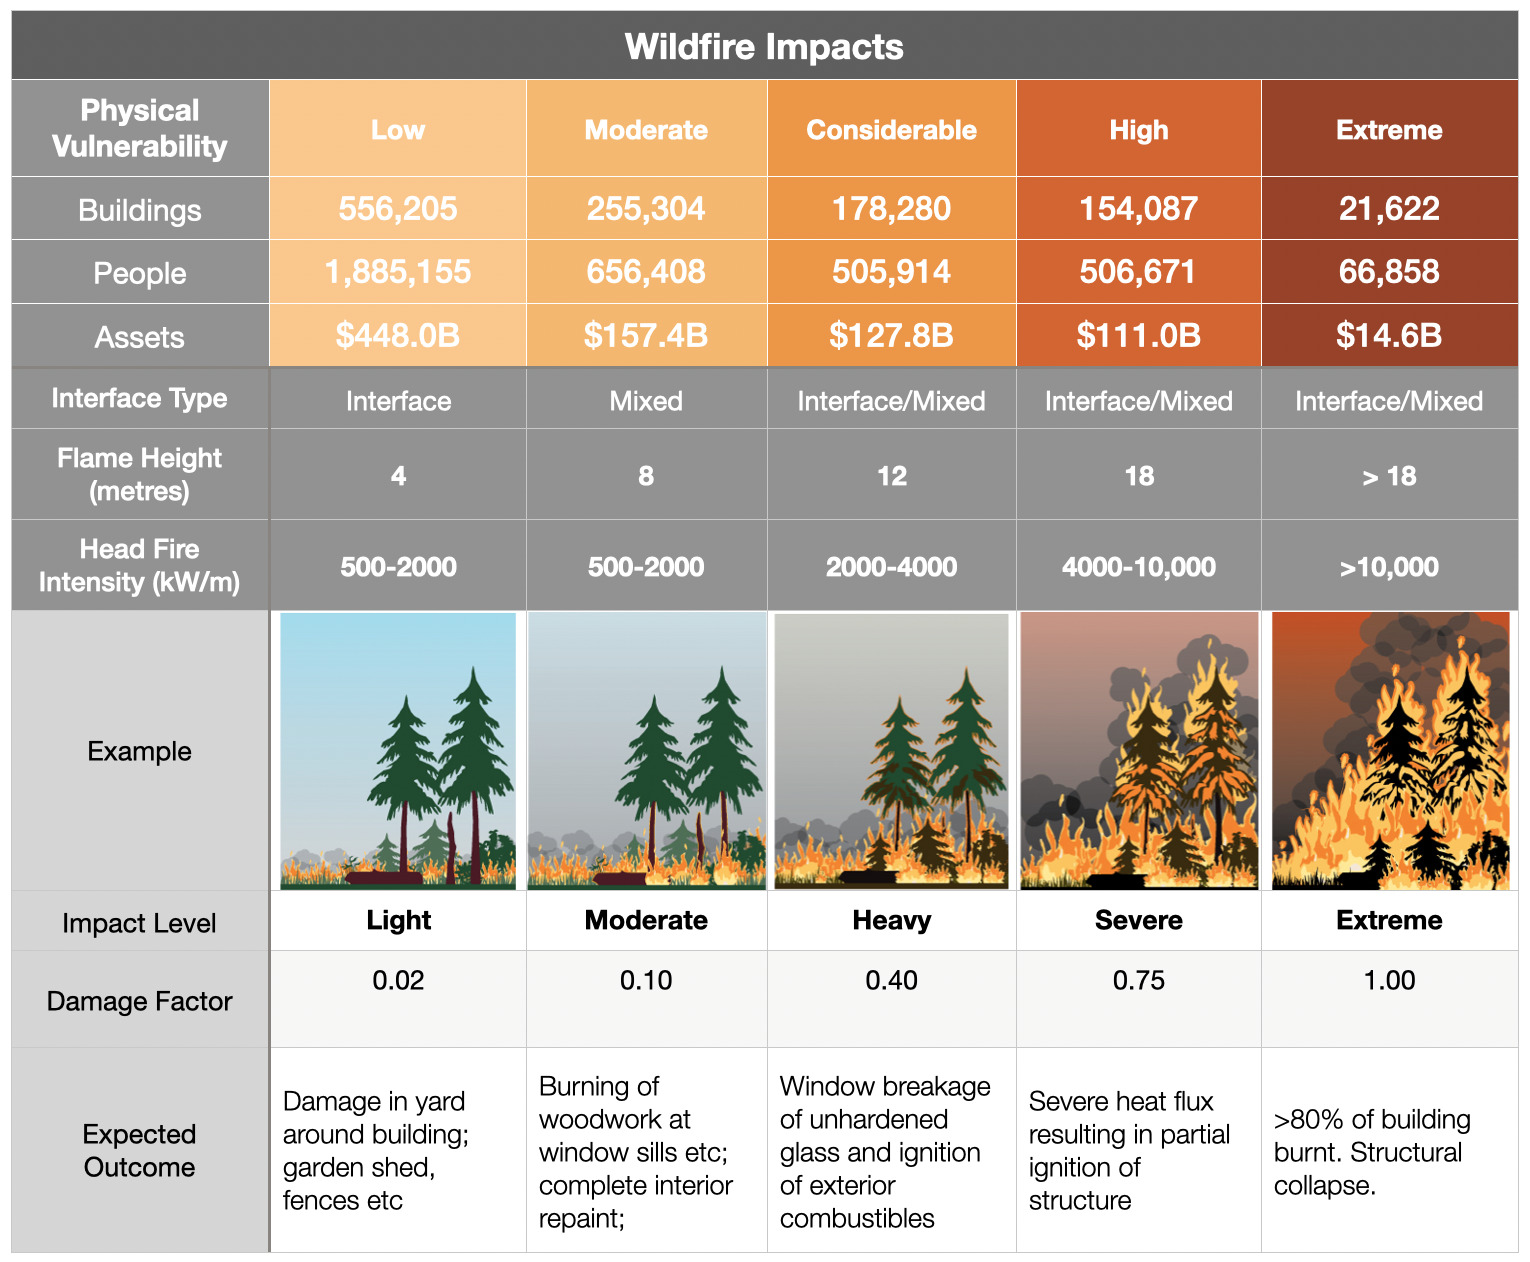
For a more general regional assessment of wildfire threat, we use existing damage scales that relate head fire intensity to five general damage states based on a combination of overall wildfire potential (energy output and spread rate) and physical impacts that have been documented in large interface fires (Klein, Greiving, and Jarva 2006; Maranghides and Mell 2009; Maranghides and Mell 2013). Results indicate that wildfire impacts are distributed across all five damage states (Low, Moderate, Considerable, High and Extreme) with relatively high concentrations in areas where head fire intensities exceed 4,000 kWm with corresponding flame heights of between 12 and 18 metres (See Figure 33 and 35).
Ignition of structures would be expected under these conditions, either by radiant heat generated along the immediate fire front and/or by secondary ignitions of vegetation or structures caused by firebrand embers carried into neighbouring built-up areas by strong winds that are often associated with big fires. Hotspot areas of greatest concern include Alberta with 251,775 buildings exposed to significant wildfire hazards (87% of total damage profile), British Columbia with 123,360 buildings exposed (58% of total) and Ontario with 52,400 buildings exposed (31% of total). Manitoba and New Brunswick have lower exposure counts overall (29,877 and 26,605) with areas of significant damage potential ranging between 64% and 27% of the total exposed inventory, respectively.
Wildfire Threat
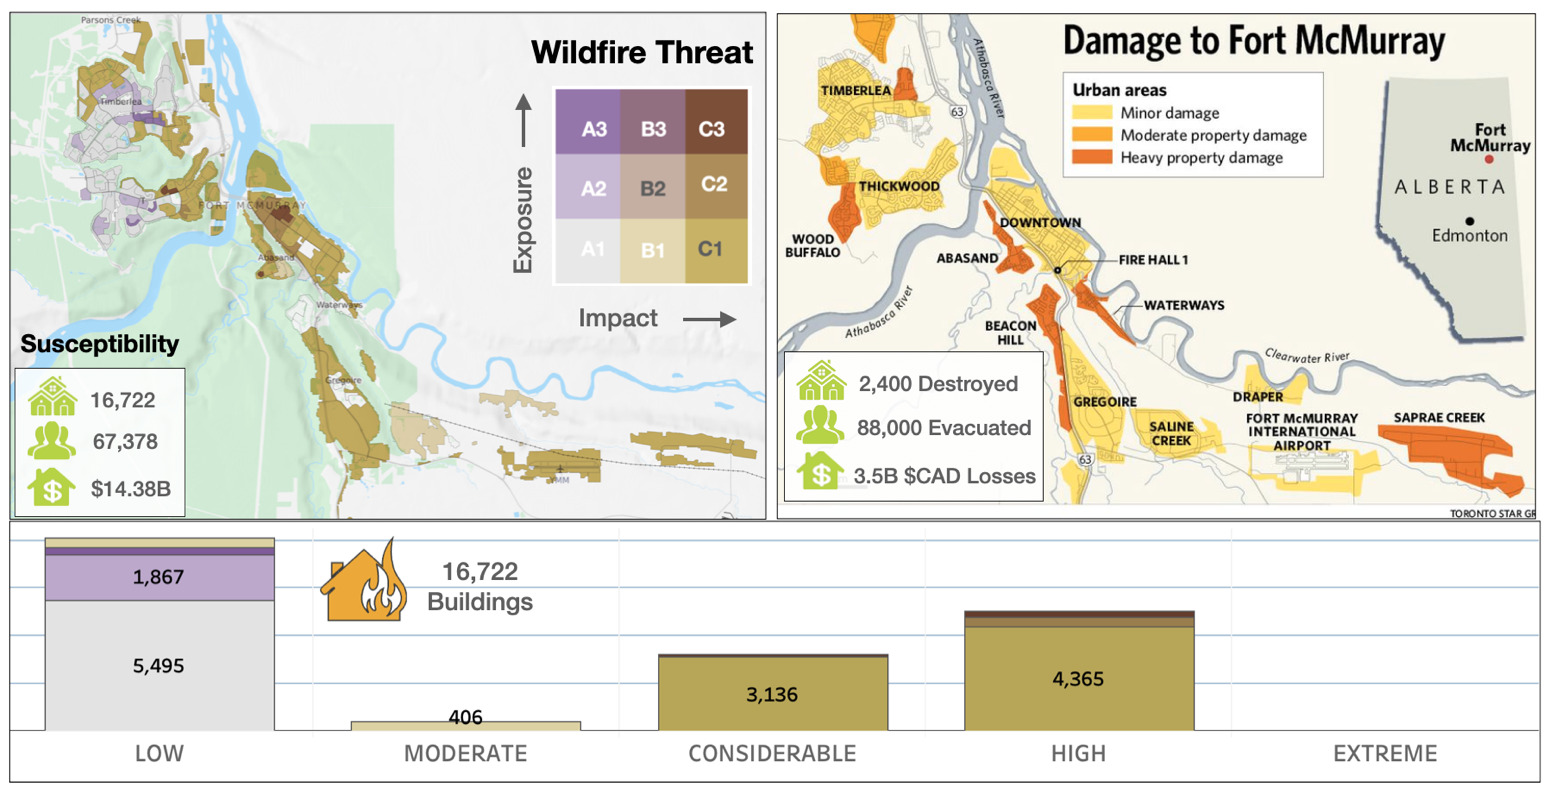
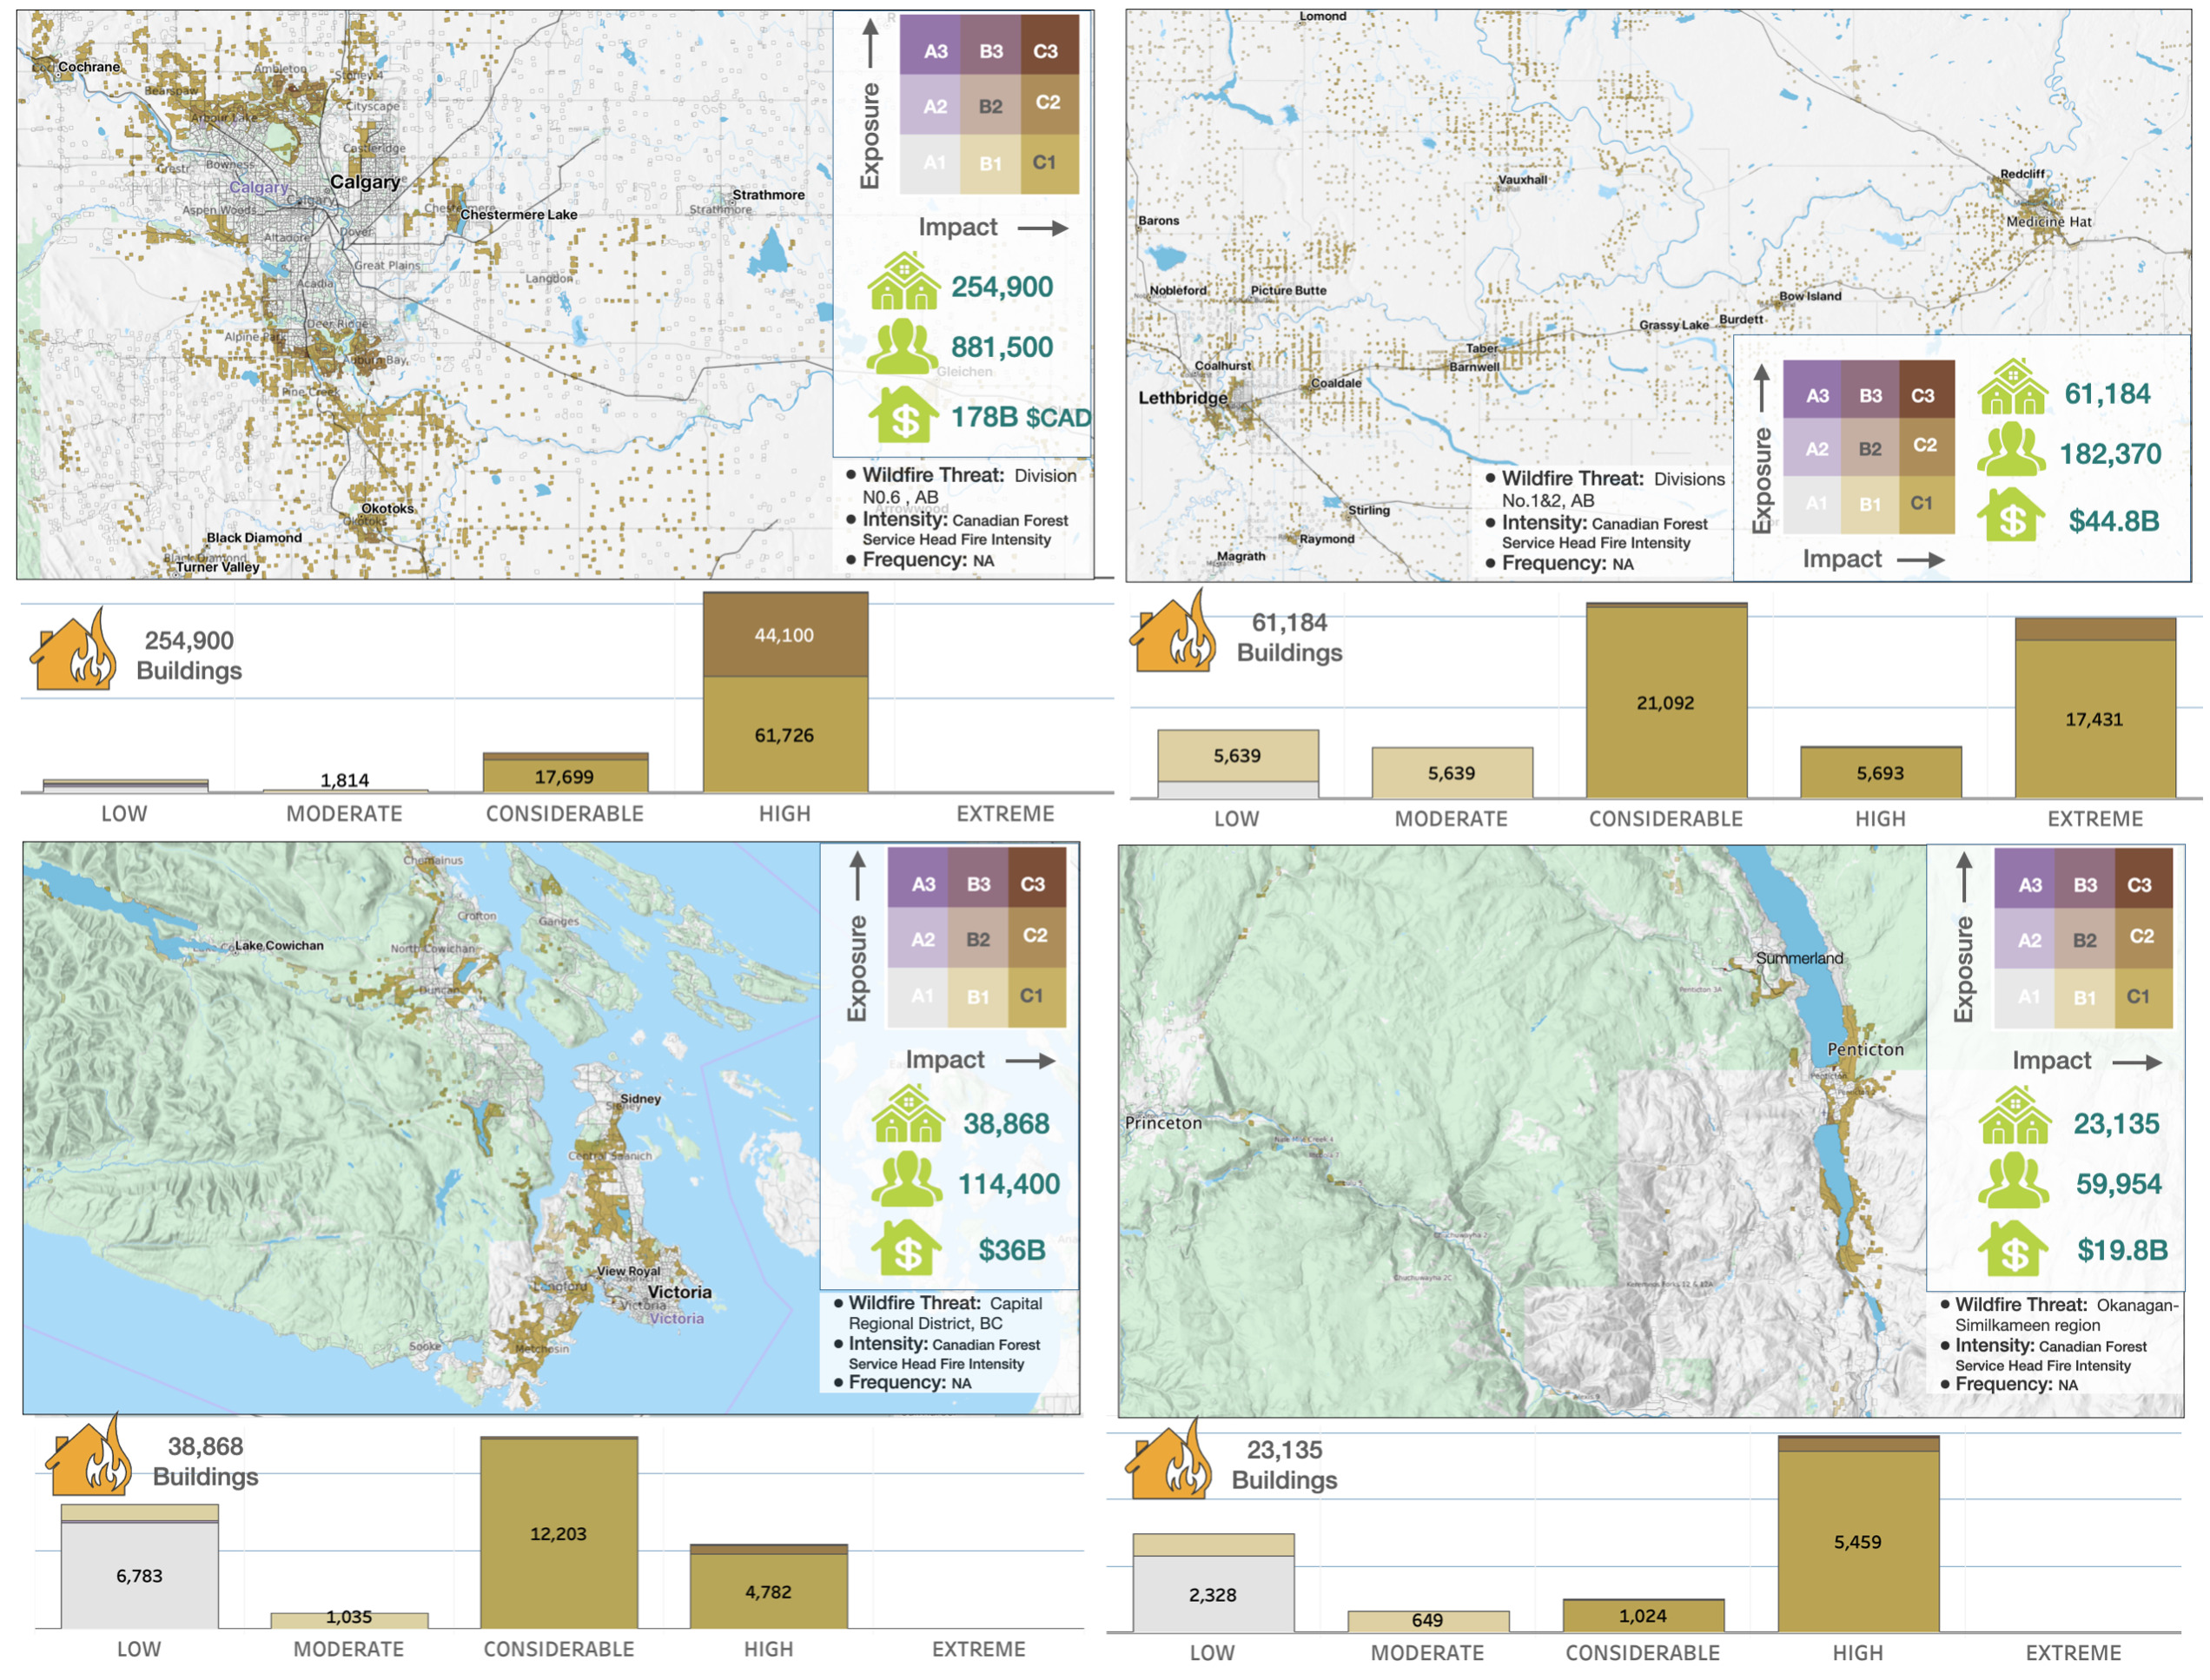
Patterns of wildfire threat are explored through the lens of bivariate maps and corresponding summary charts that provide insights on both cause-effect relationships and spatial interactions between the contributing variables of wildfire hazard and physical exposure. We begin by comparing predicted patterns of wildfire threat with results of observed impacts from the 2016 Fort McMurray wildfire event (See Figure 34). The Wood Buffalo region includes 8,580 hectares of wildland-urban interface area with 36% (~3,100 ha) concentrated in the region immediately surrounding Fort McMurray. Nearly 50% of all WUI asset locations are concentrated in mixed low and medium-density residential neighbourhoods representing ~16,700 buildings, 67,380 people and capital assets estimated to be worth more than 14.4B $CAD. Impacts of the 2016 wildfire event resulted in the destruction of 2,400 residential and commercial structures (Mamuji and Rozdilsky 2019), representing ~16% of the total WUI inventory. Insured losses from damaged and destroyed structures are estimated to have been 3.8B $CAD (Swiss Re 2019), representing 31% of the estimated 12.5B $CAD in capital asset value.
While the spotlight has understandably been on the communities of Fort McMurray and Slave Lake, the potential for large fires in wildland-urban-interface regions of the Rocky Mountains and adjacent areas of southern Alberta are of equal concern (Figure 36A). This includes urban fringe communities around Calgary and a band of high wildfire threat that extends eastward from Crowsnest Pass through Lethbridge to Medicine Hat. The area surrounding Calgary encompasses 161,890 hectares of wildland-urban interface with the majority (~77%) represented by smaller concentrations of built-up area dispersed within a wildland fire zone with broad zones of elevated hazard potential. There are a total of 7,152 asset locations within the wildland-urban-interface representing 254,900 buildings, 881,500 permanent residents and ~177.9B $CAD in capital assets. Most of the hazard threat is concentrated in zones of high damage potential distributed across both low and medium density neighbourhoods.
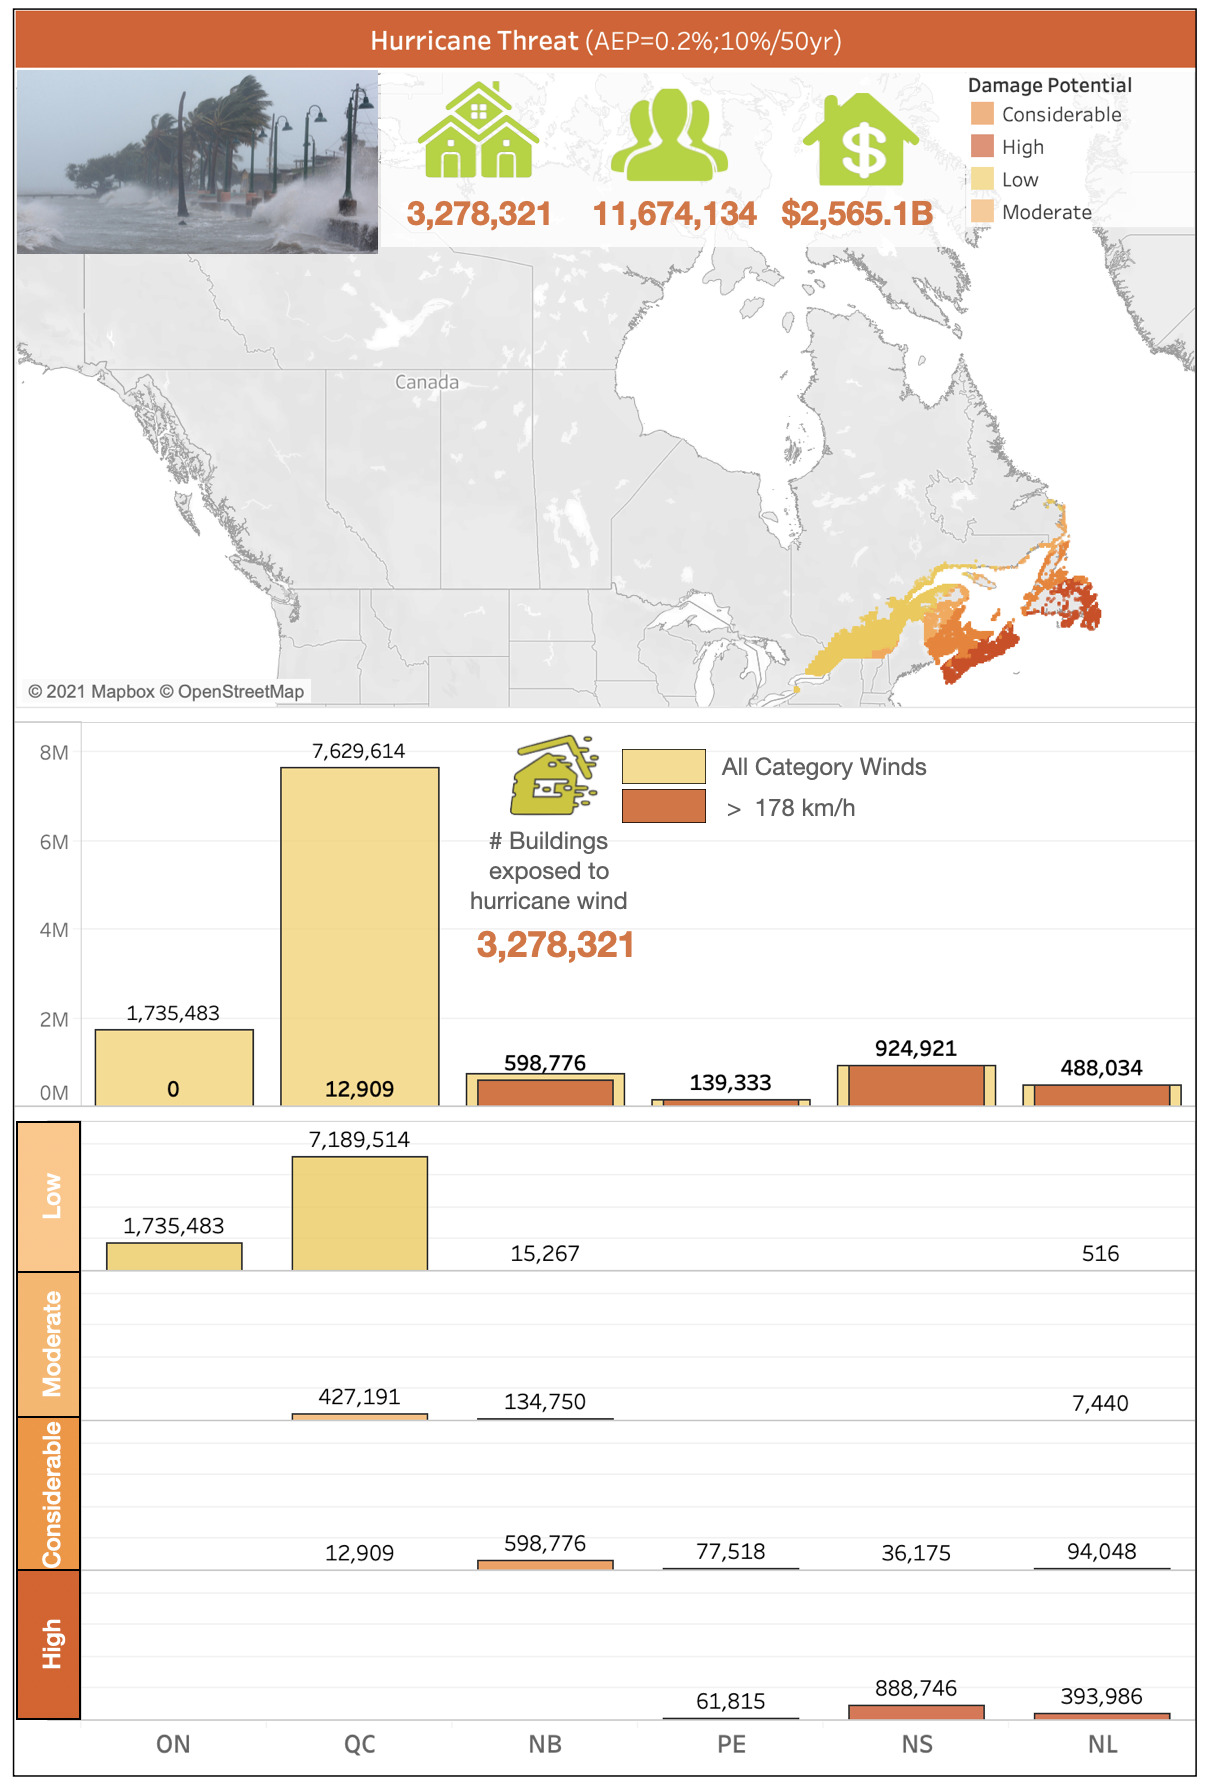
Regions to the south, encompassing rural lands surrounding Lethbridge and Medicine Hat encompass 5,685 hectares of built-up areas with ~90% represented by mixed wildland interface (Figure 36B). The overall pattern of wildfire threat is skewed toward considerable, high and extreme levels of damage potential with 61,184 buildings, 182,370 people and 44.8B $CAD situated in scattered rural settlements and low-density residential neighbourhoods surrounding Lethbridge, Medicine Hat and smaller towns situated along transportation corridors leading north to Calgary.
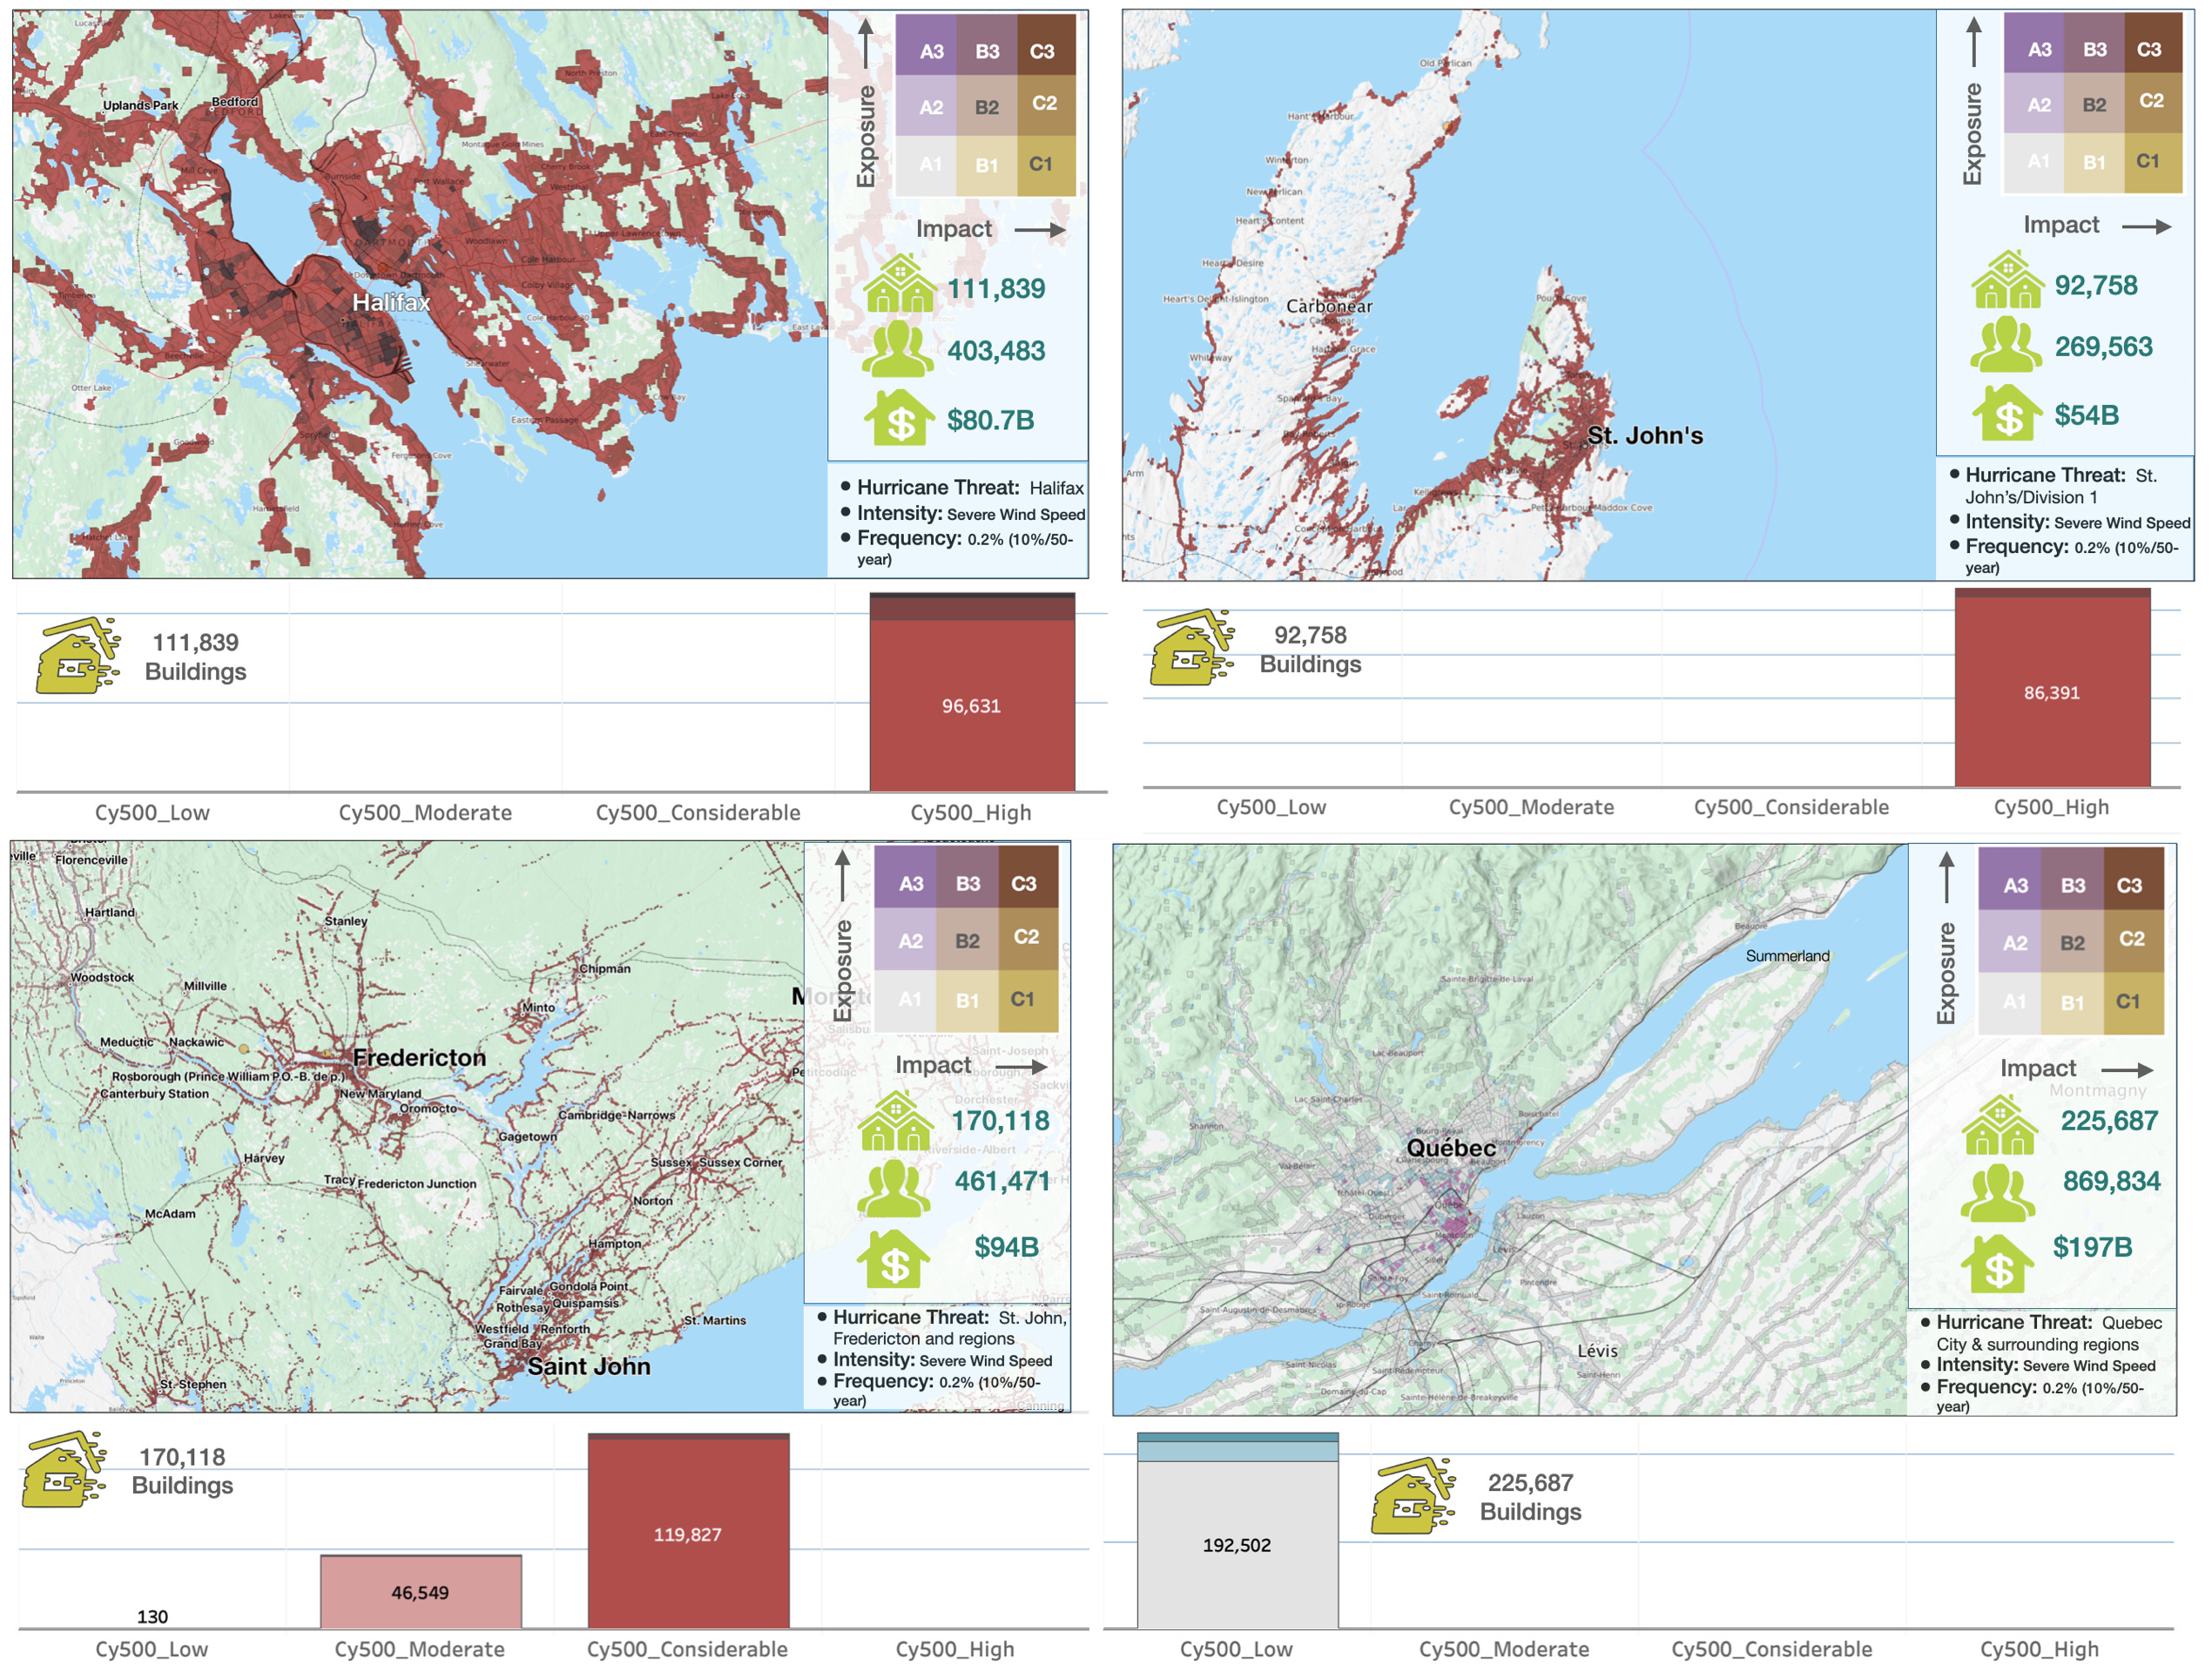
British Columbia has many isolated pockets of wildfire hazard threat situated along major mountain valleys of the interior and along the south coast of Vancouver Island. The Capital Regional District of southern Vancouver Island is situated in a region of high wildfire hazard potential with built-up areas of the wildland-urban interface representing 29,830 hectares of land that is primarily concentrated along the fringes of larger settled areas including Duncan, the Central Saanich Peninsula, Langford and Metchosin (Figure 36C). While there have been no historic wildfire disasters in this region, southern Vancouver Island is characterized by relatively high hazard potential with ignition source zones increasing toward the coastlines bordering the Salish Sea. Exposed assets within this region include 38,685 buildings, 114,400 people and ~36B $CAD in capital assets. Exposure is concentrated primarily in low-density residential neighbourhoods exposed to considerable and high levels of wildfire threat.
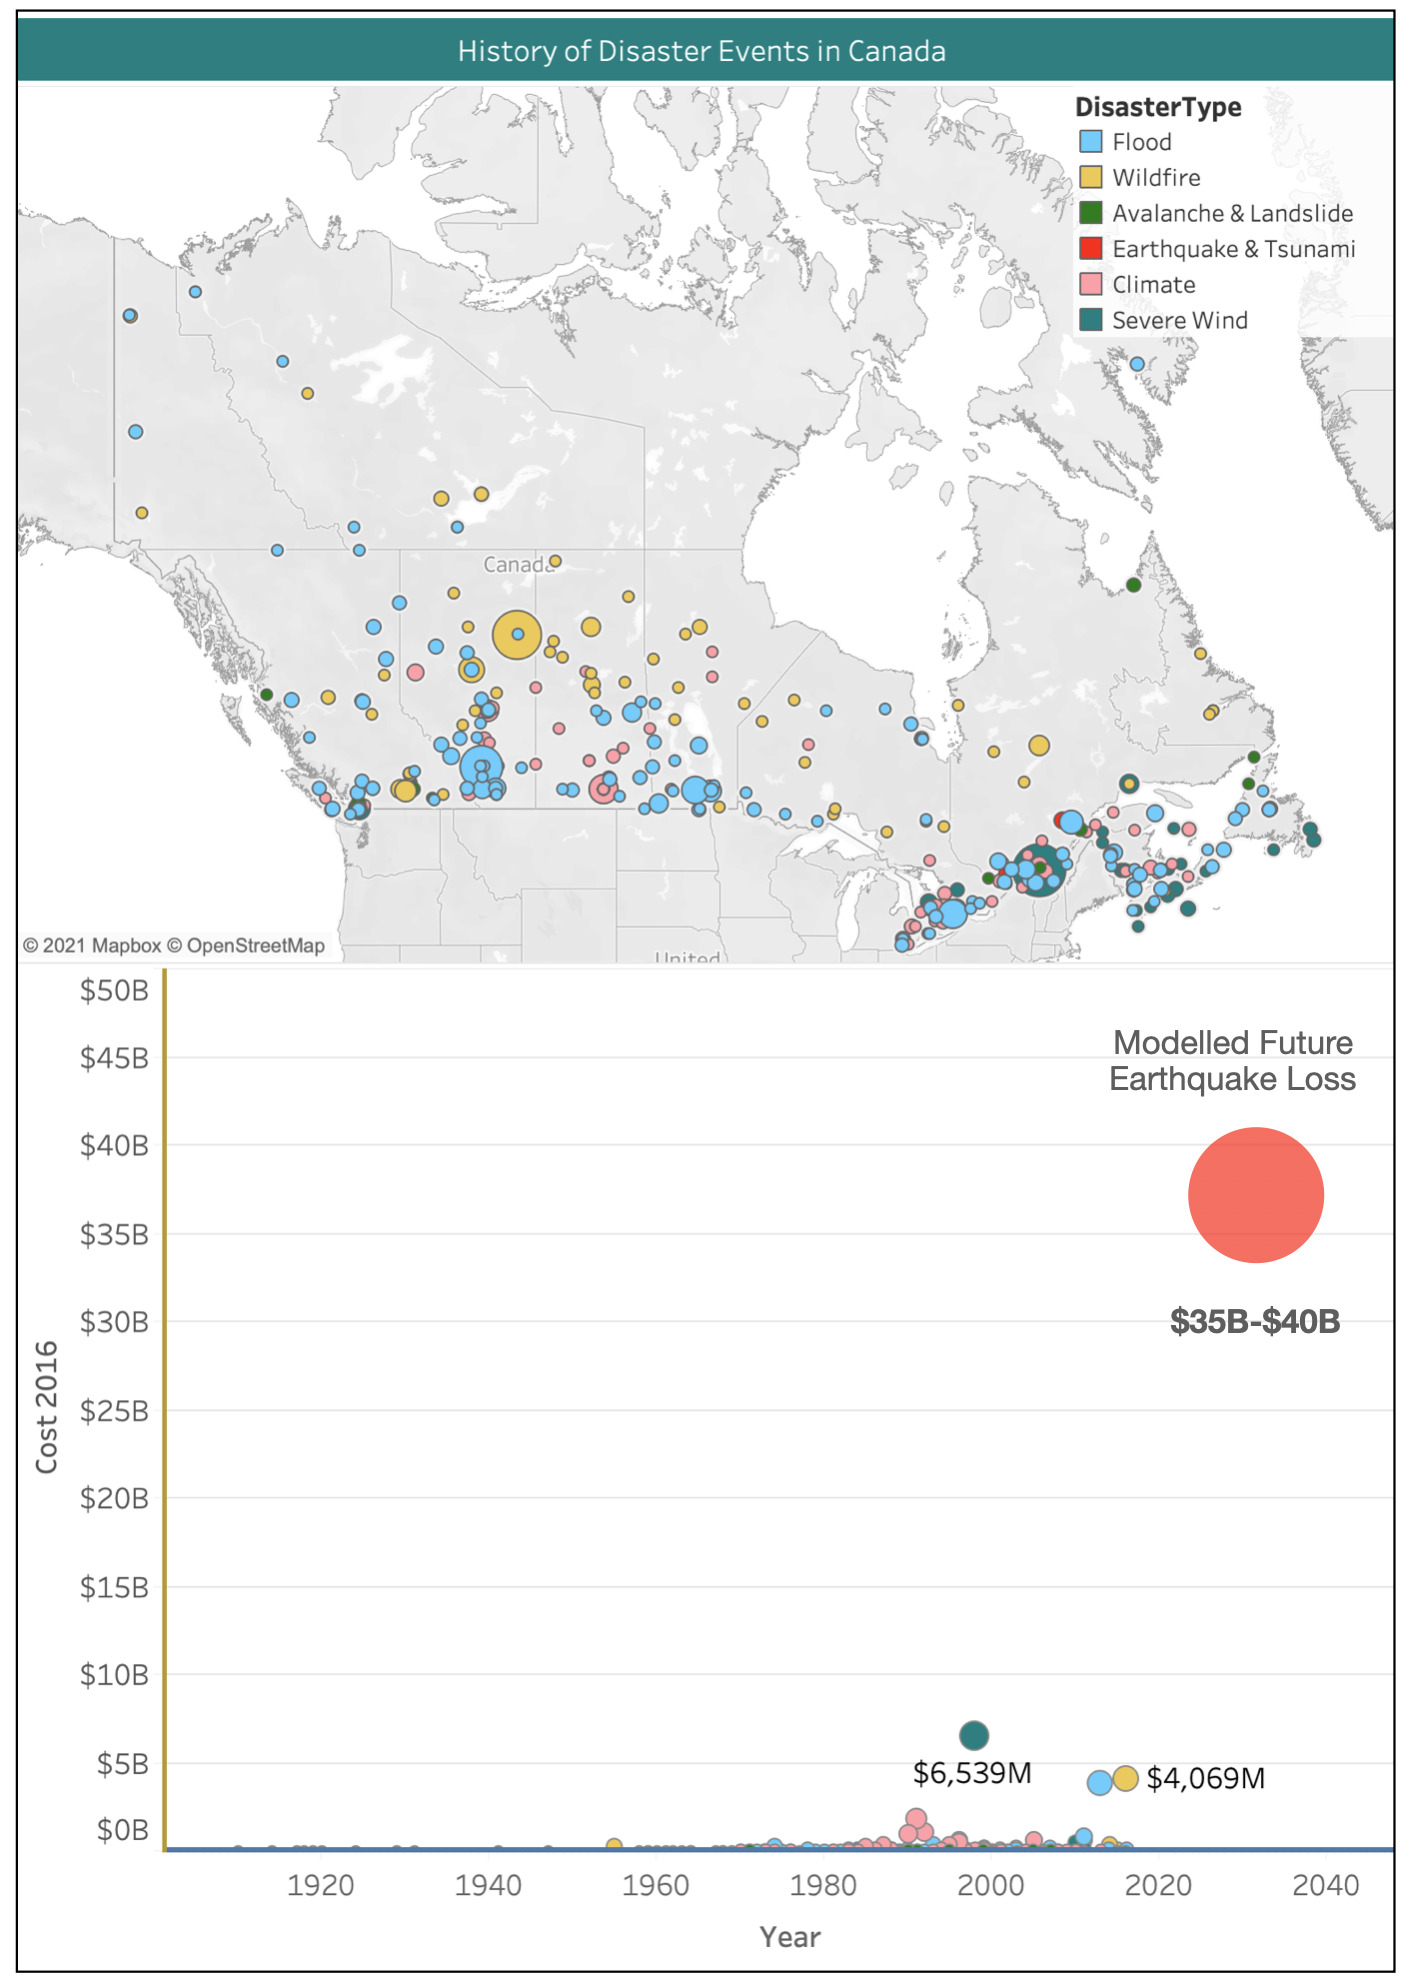
The Mountain Park wildfire event occurred in the central Okanagan Valley region during the 2003 fire season and represents the most significant interface wildfire events in BC history (BC Wildfire Service 2021). Primary impacts were most acute in the community of Naramata and in the foothills surrounding Kelowna. 238 homes were destroyed or severely damaged more than 33,000 people were evacuated. The fire also destroyed 12 historic wooden trestles along the Myra Canyon and caused significant disruption in the region. Two decades earlier, the Garnet fire near Penticton burned over 5,500 hectares and destroyed 18 homes with 3,500 people evacuated from the region. Significant wildfire threat remains in the region surrounding Penticton with ~28,999 hectares of wildland-urban-interface area and over 8—asset locations representing 23,135 buildings, 59,950 people and 19.8B $CAD in capital assets (Figure 36D). Wildfire hazards are of greatest concern in mixed interface areas exposed to considerable and high levels of damage from big fires that are likely to occur again in the future.
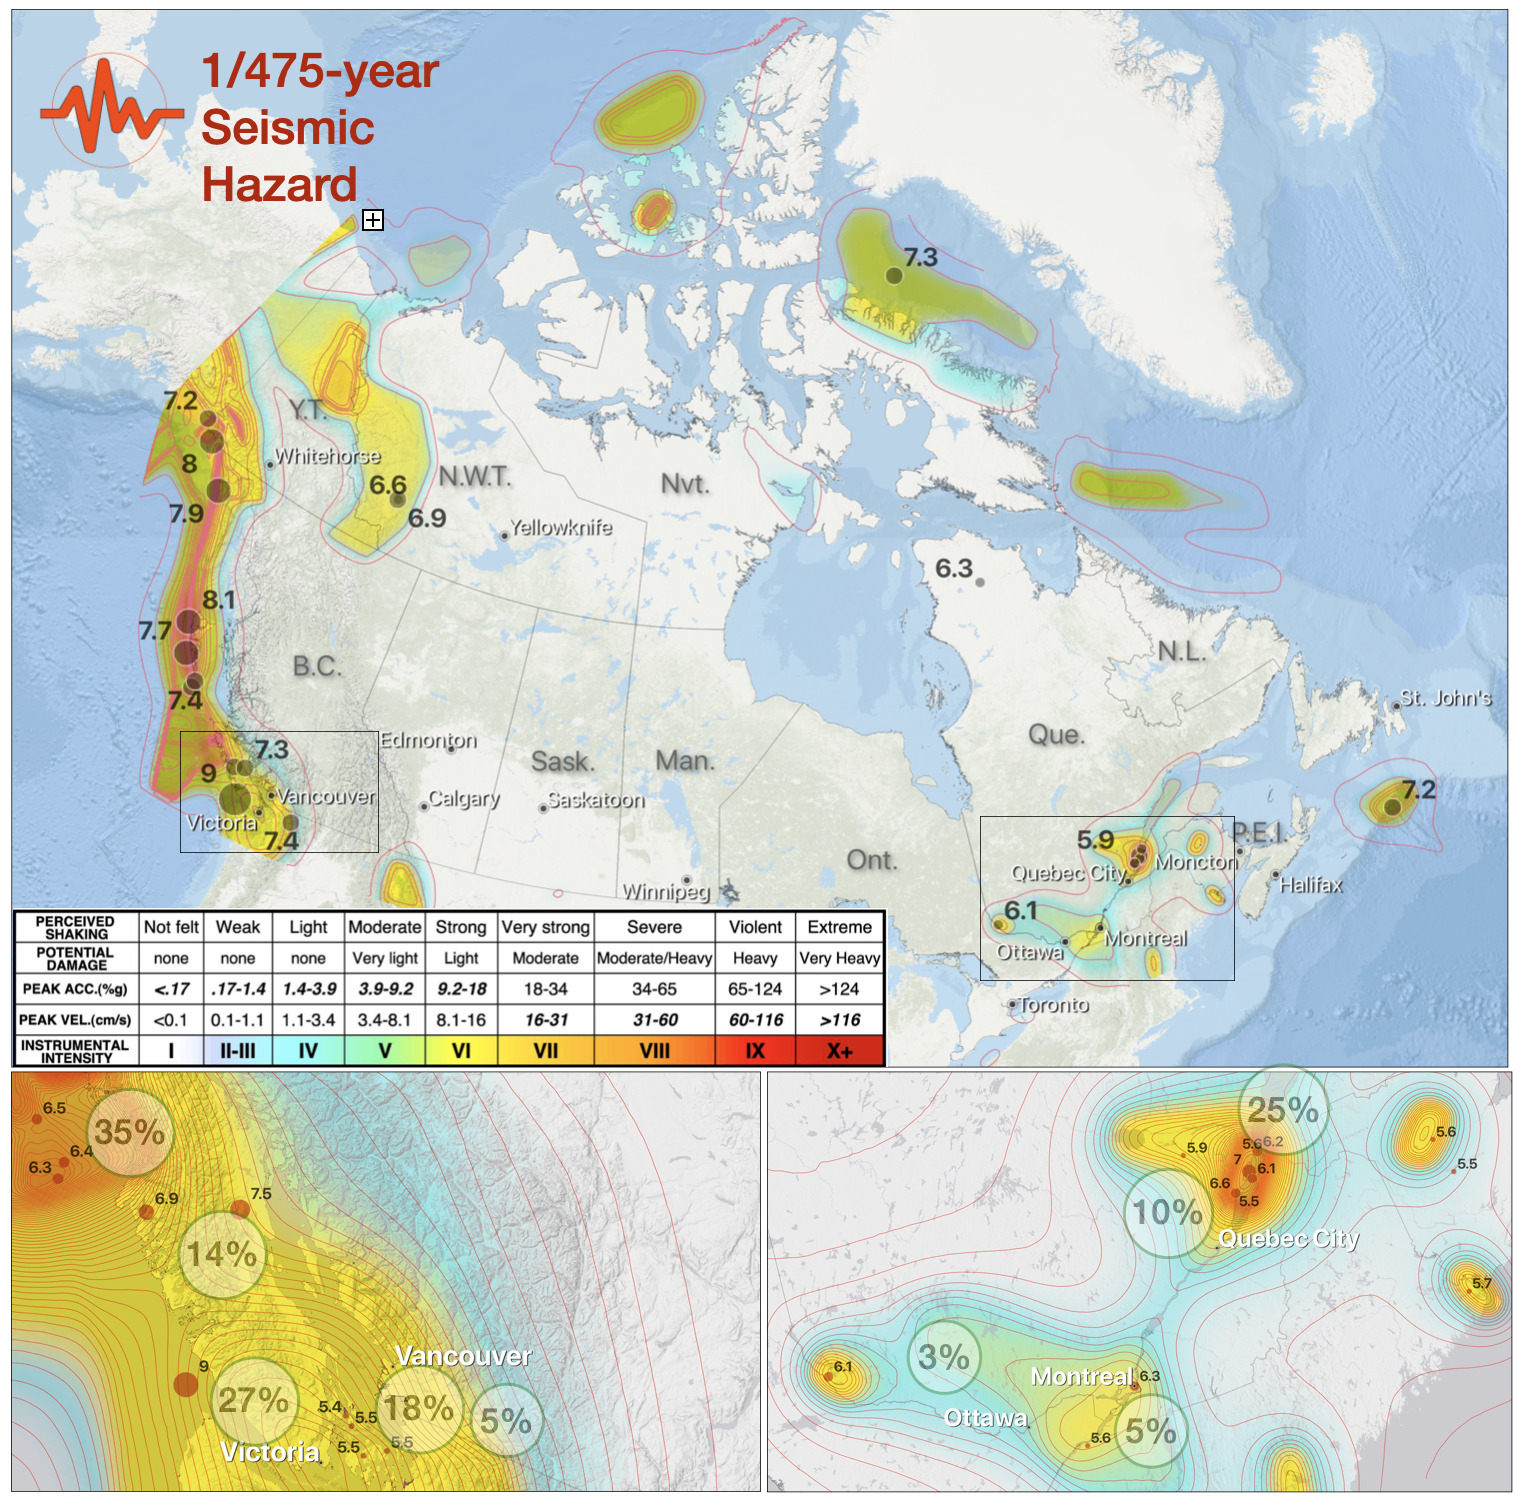
Our assessment of wildfire threat provides a first-order screening of hotspot regions of concern and complements existing regional models that have delineated the full extent of the wildland fire zone in Canada (Johnston and Flannigan 2018). While the outputs of our work help identify broad patterns of wildfire threat, site-level studies are required to assess the likelihood of ignition and spread within the wildland-urban-interface and to identify opportunities for mitigation and risk reduction in alignment with national FireSmart guidelines (Beverly et al. 2018; Beverly et al. 2010).
Hurricane
The eastern seaboard of Canada is the landing zone for tropical cyclones (aka hurricanes) that sweep in from the south Atlantic Ocean (Figure 37). They typically make initial landfall in the southern United States and then tracking northward along the coast wreaking havoc in their wake. As they travel north, these massive weather systems encounter cooler temperatures and begin to degrade into what are known as extra-tropical cyclones that generate severe wind and related secondary hazards including heavy rainfall, flooding and coastal storm surge. Extreme winds of 118 km/hr or more can result in the uprooting of trees, significant damage to buildings and loss of life due to a combination of structural failure and the secondary impacts of objects being blown down and carried in the wind. Heavy rainfall that accompanies these severe storms often exceeds 60 centimetres over a 24-hour period leading to severe riverine and overland flooding. Strong winds associated with hurricanes can also create storm surges of several metres above mean seal level, pushing water up onto exposed coastal areas and causing severe flooding.
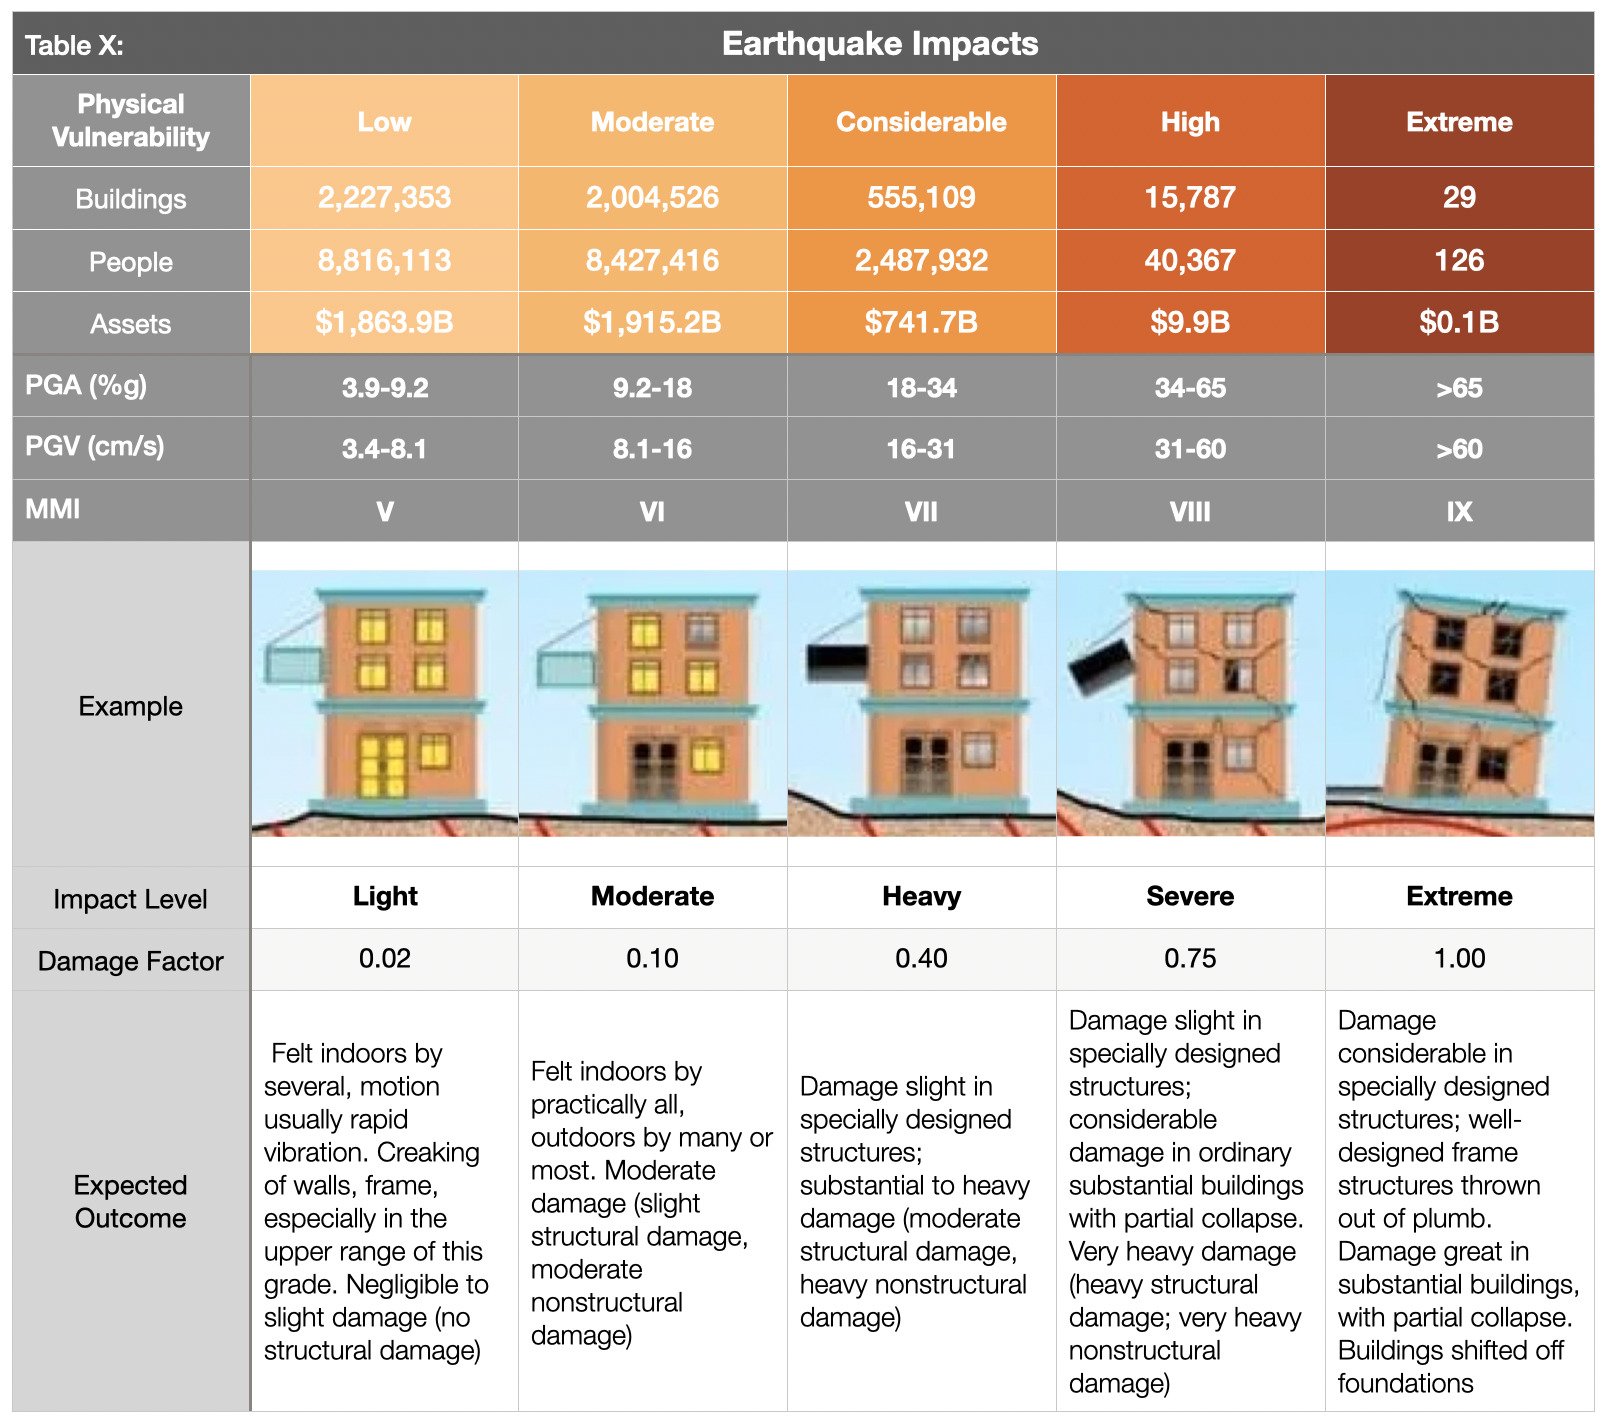
There is a long history of severe storms dating back several hundred years in Canada (Figure 38). The 1775 Newfoundland hurricane event (Independence Day) is reported to have killed more than 4,000 people when high winds and storm surge of ~10 metres struck the Avalon Peninsula overturing boats and drowning mariners and those along shorelines up and down the coast (Ruffman 1996). Subsequent disaster events include the Galveston Hurricane of 1990 in which several hundred people were killed, Hurricane Hazel in 1954 which left 81 people dead (See Figure X). The intensity and frequency of severe storm events have been increasing over the past several decades reflecting the contributing influences of climate change (Knutson et al. 2010; Rogelj, Meinshausen, and Knutti 2012). Hurricane Juan in 2003 struck the shores of Nova Scotia with winds of up to 140 km/hr tearing down trees, destroying marinas and leaving more than 300,000 people without power for weeks. Hurricane Noel in 2007 and Hurricane Igor in 2010 both carried winds of 140-180 km/hr causing significant damage in coastal settlements of Cape Breton and associated flooding that resulted in several hundred million dollars each in financial losses.
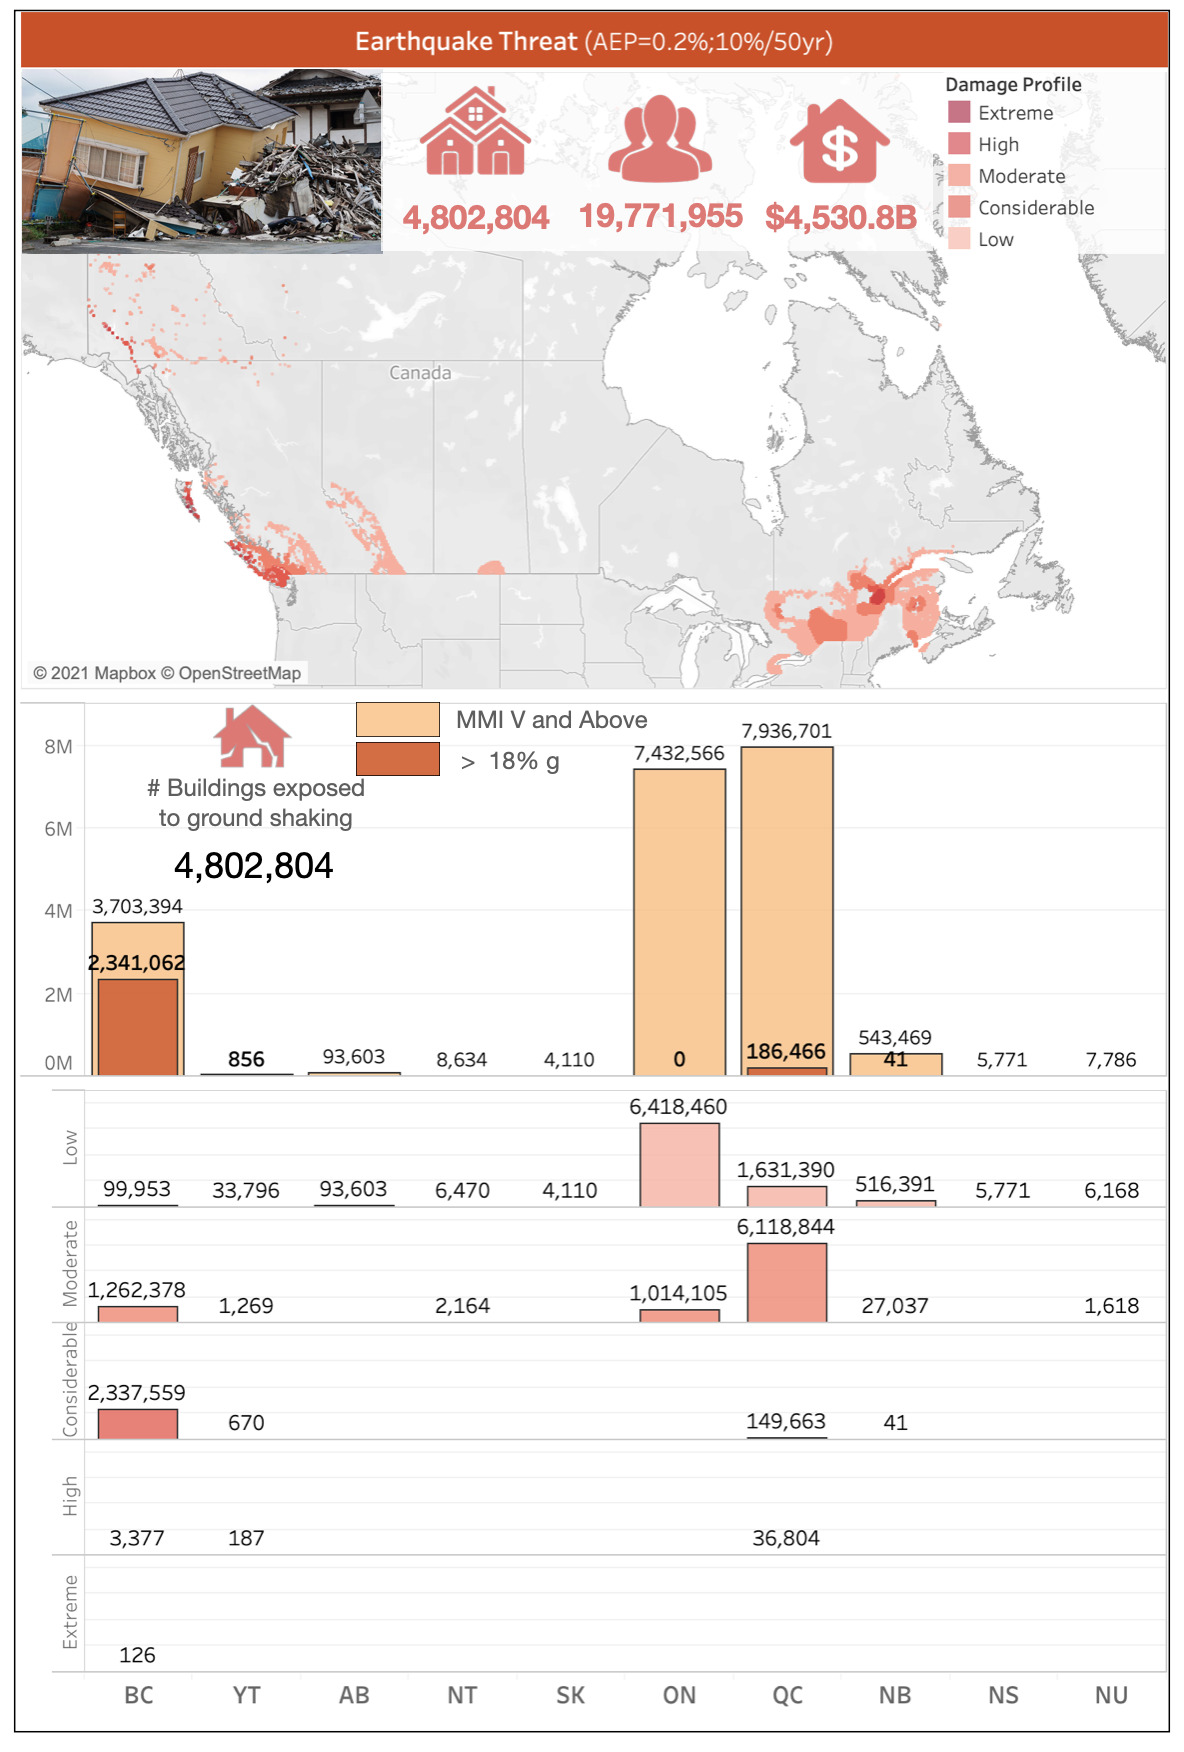
Hazard Intensity
Understanding the behaviour of tropical cyclones and their evolution as they make landfall and travel inland has advanced significantly in recent years, leveraging the combined insights from an ensemble of global models that are refining both predictions of future events and probabilistic models that characterize magnitude-frequency relationships for variable time horizons under conditions of climate change (Ulbrich, Leckebusch, and Pinto 2009; Colle et al. 2013; Hunter et al. 2016; Colle, Booth, and Chang 2015; Bloemendaal et al. 2020).
Severe wind hazards considered for this study are based on a global model of cyclonic wind speeds at an average annual exceedance probability of 0.2% (10% in 50-years). The GAR15 model, developed in support of the 2015 Global Assessment Report (Desai et al. 2015; UNISDR 2015), incorporates information on more than 2,500 historical storm events, terrain roughness and bathymetry to estimate both wind speeds and storm surge events capable of causing significant damage and/or disruption. Areas exposed to severe wind hazards in Canada include the Maritime Provinces of Nova Scotia, Newfoundland-Labrador, New Brunswick and Prince Edward Island. Less severe but potentially damaging wind hazards also exist along the St. Lawrence Seaway and Lowland regions of Quebec and southeastern Ontario.
Damage Potential
Significant advances have been made in recent years to develop physical vulnerability models that relate the probability of hurricane damage and loss to peak wind speed and related secondary hazards (Vickery, Skerlj, et al. 2006; Vickery, Lin, et al. 2006; Federal Emergency Management Agency 2006). These physics-based models use load-resistance fragility functions to estimate damage state probabilities for specific building construction types. Corresponding vulnerability functions are then used to estimate the extent of loss and injury based on cumulative damage profiles.
While building-specific exposure information is available to support implementation of a national hurricane risk model, we currently lack information to characterize detailed parameters of hazard intensity and building performance that are needed to refine fragility and vulnerability functions for use in a Canadian context. Nonetheless, semi quantitative relationships between wind speed intensity and likely damage to buildings and related social disruption are well-known from forensic studies of past disaster events (Figure 40).
The Saffir-Simpson Hurricane Wind Scale categorizes damage potential on the basis of peak wind speed intensity thresholds measured at a standard meteorological observation height of 10 metres over unobstructed ground (Taylor et al. 2010). Levels of anticipated damage increase by a factor of four for each of five intensity threshold levels for severe wind speeds ranging from a Category 1 event (119-153 km/h to a Category 5 with sustained wind speeds of over 252 km/h (See Figure 39). The impacts of gale force and severe storm winds in a maritime setting that do not meet minimum thresholds for structural damage represented by the Saffir-Simpson scale are measured using the Beaufort Wind Scale.
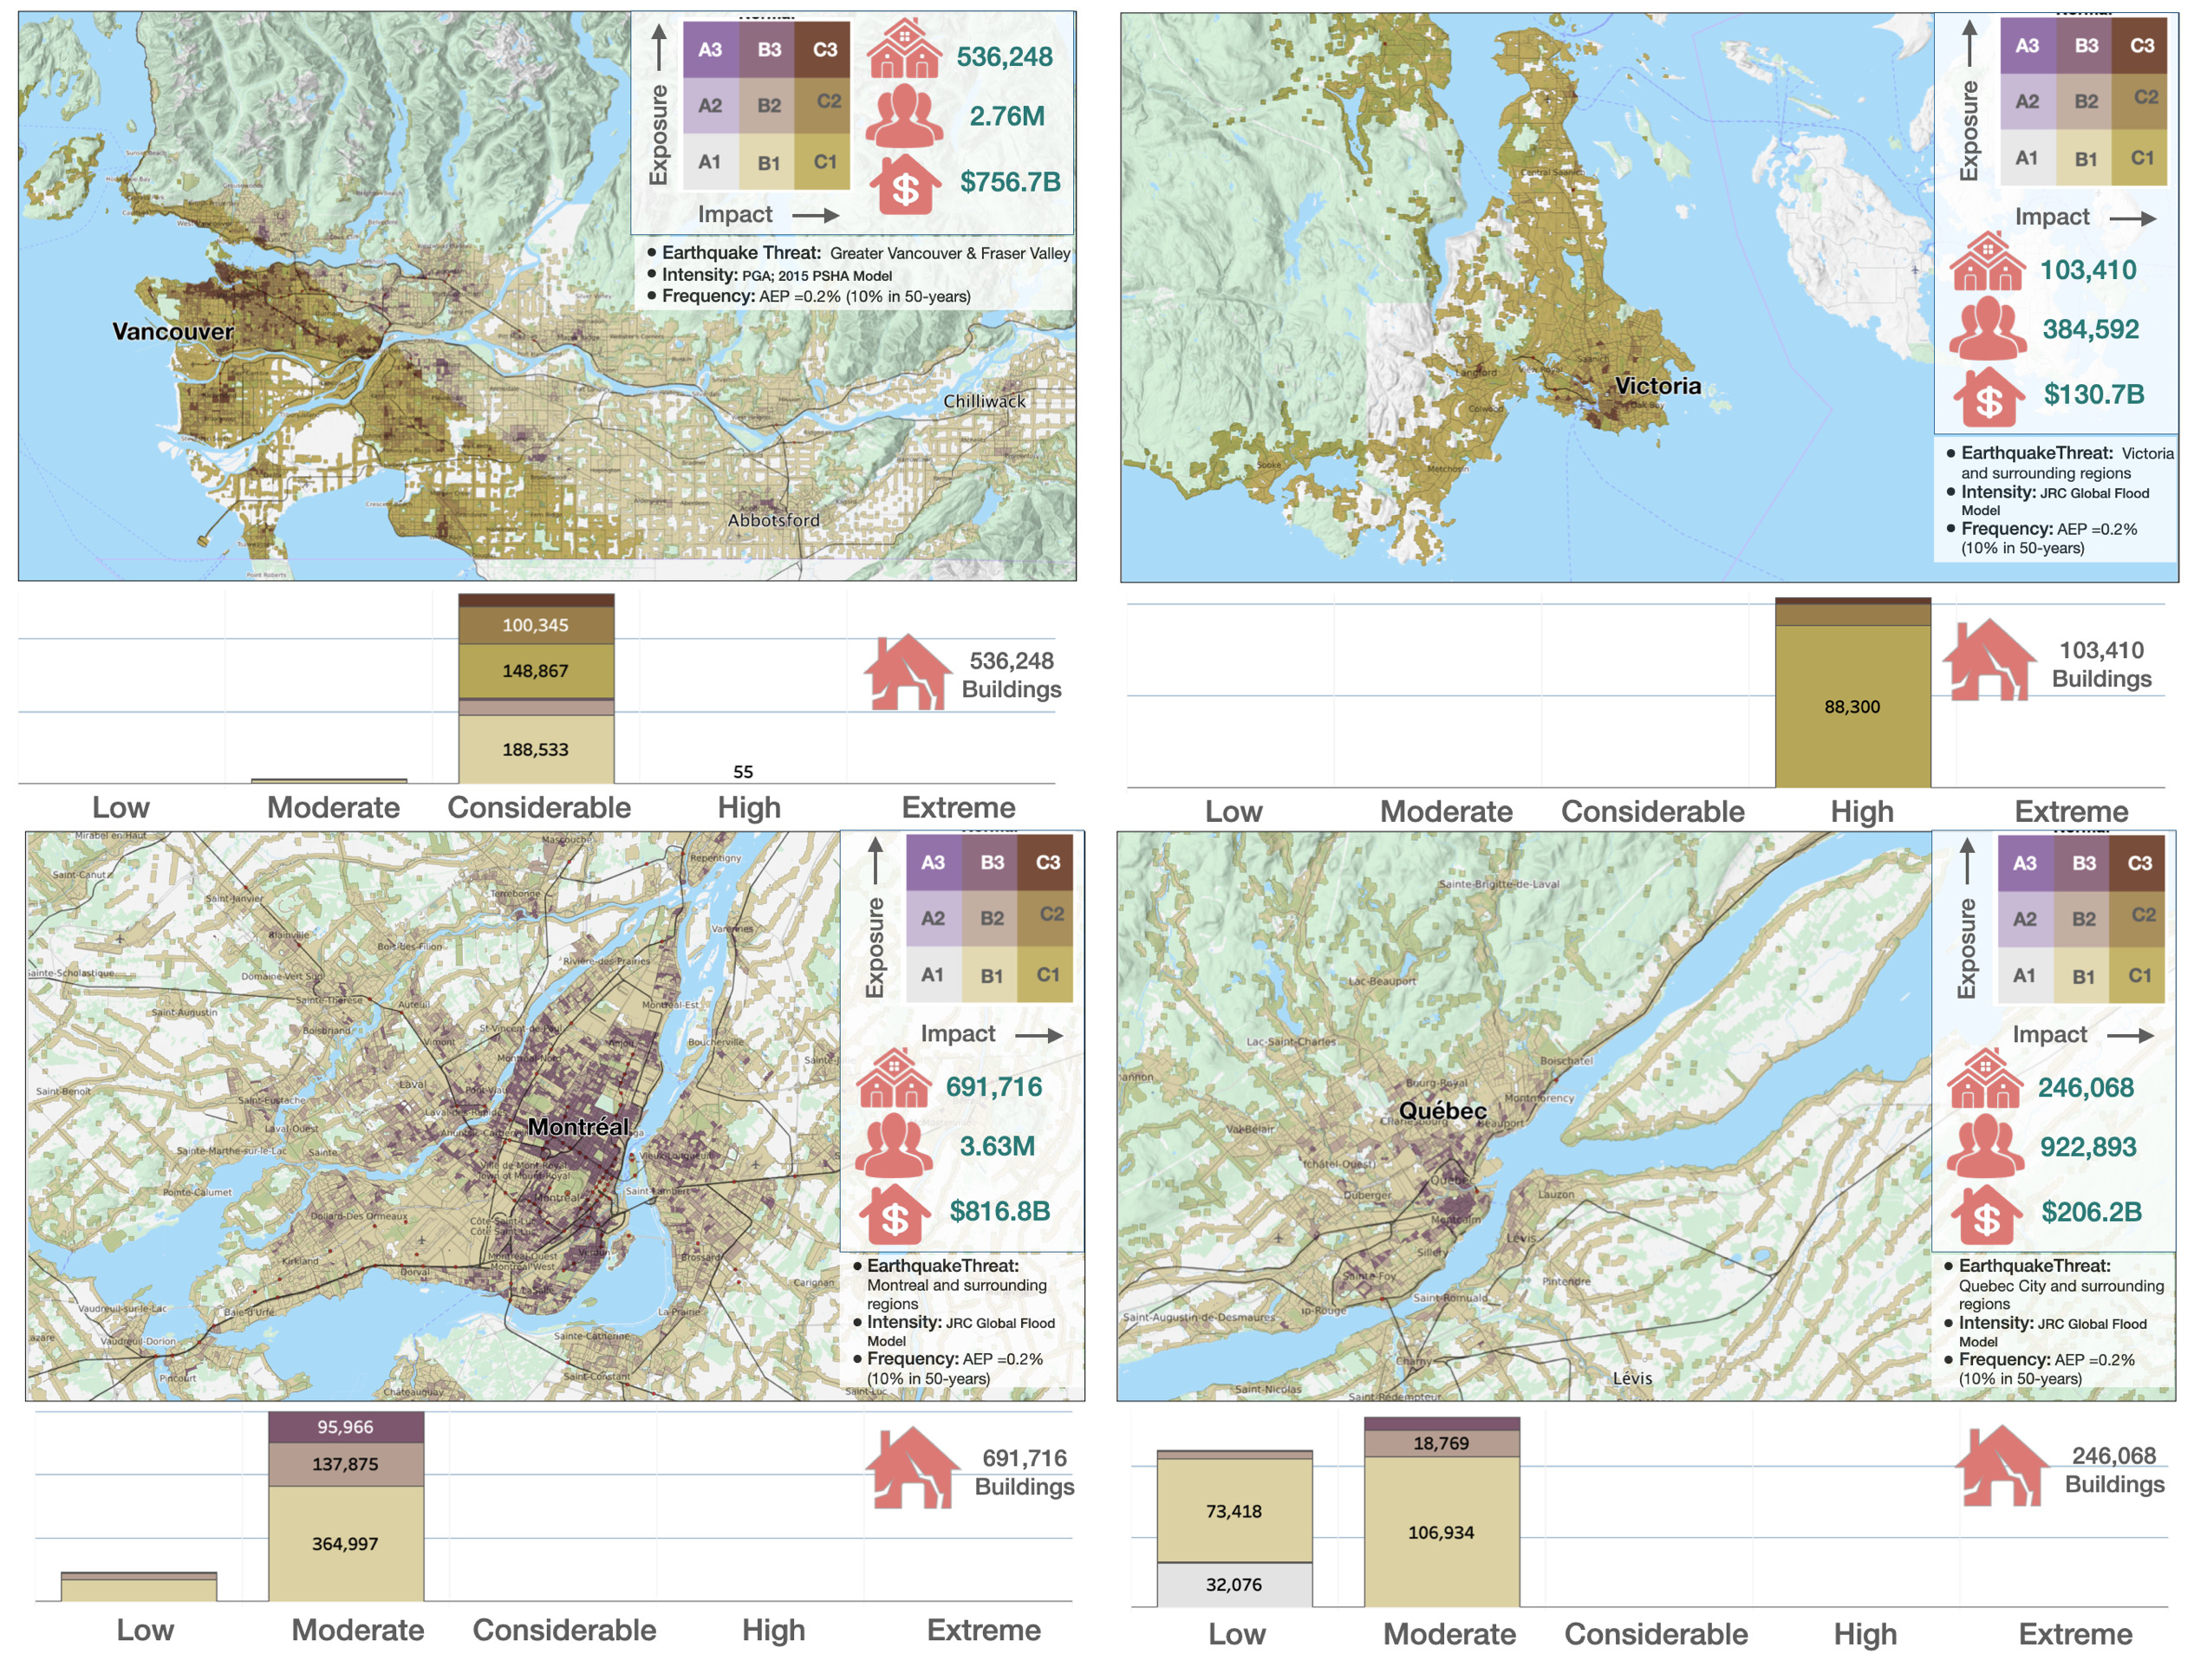
For a 10% in 50-year hurricane event in Canada (AEP=0.2%) there is potential for impacts across the first four categories of the Saffir-Simpson Damage Scale (Figure 39). Areas of light damage (Category 1 Hurricane potential) occur mostly along the St. Lawrence Lowland regions of Quebec and Ontario with ~2.3 million buildings susceptible to wind impacts affecting 8.9 million people and 1.99 trillion $CAD in capital assets. Damage profiles increase across Category 2-4 intensity thresholds to the southwest into New Brunswick, Nova Scotia and Newfoundland. Areas of moderate damage potential (Category 2) for a 10%-50-year event encompass 196,745 buildings, 589,380 people and capital assets of 125.3B $CAD. These numbers more than double in Nova Scotia and Newfoundland with 474,430 buildings, 1.34 million people and 279.4B $CAD in capital assets susceptible to high damage potential from category 4 hurricane events.
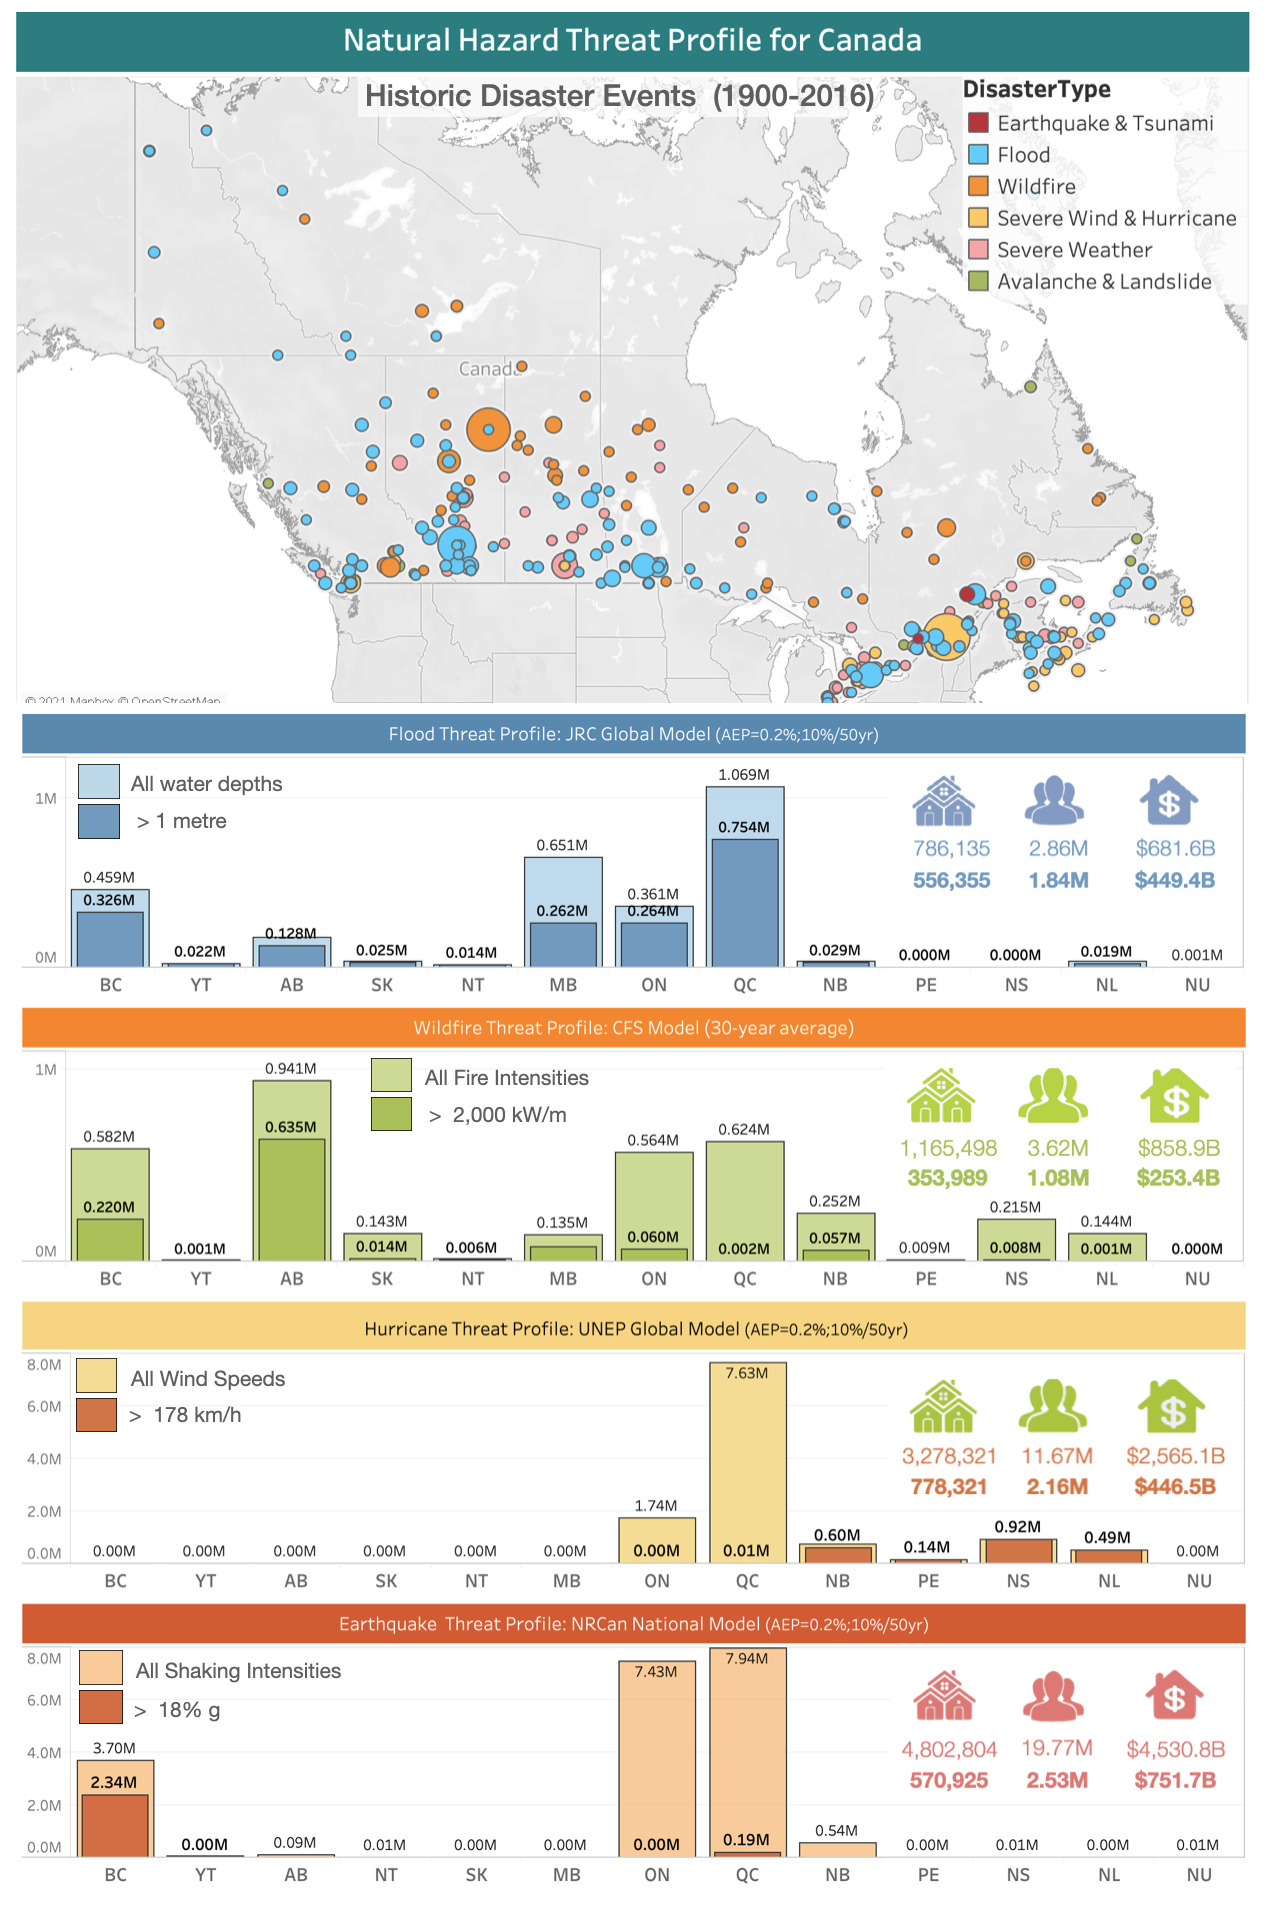
Hazard Threat
Bivariate maps of hurricane hazard threat for hotspot regions in eastern Canada and the Maritimes highlight variations in damage potential within larger municipalities and surrounding regions (See Figure 41). In descending order of hurricane threat, these include the Halifax region of Nova Scotia, St. John’s and surrounding regions of northeast Newfoundland (Division 1), the Saint John-Fredericton corridor of New Brunswick, and the region surrounding Quebec City along the St. Lawrence Seaway.
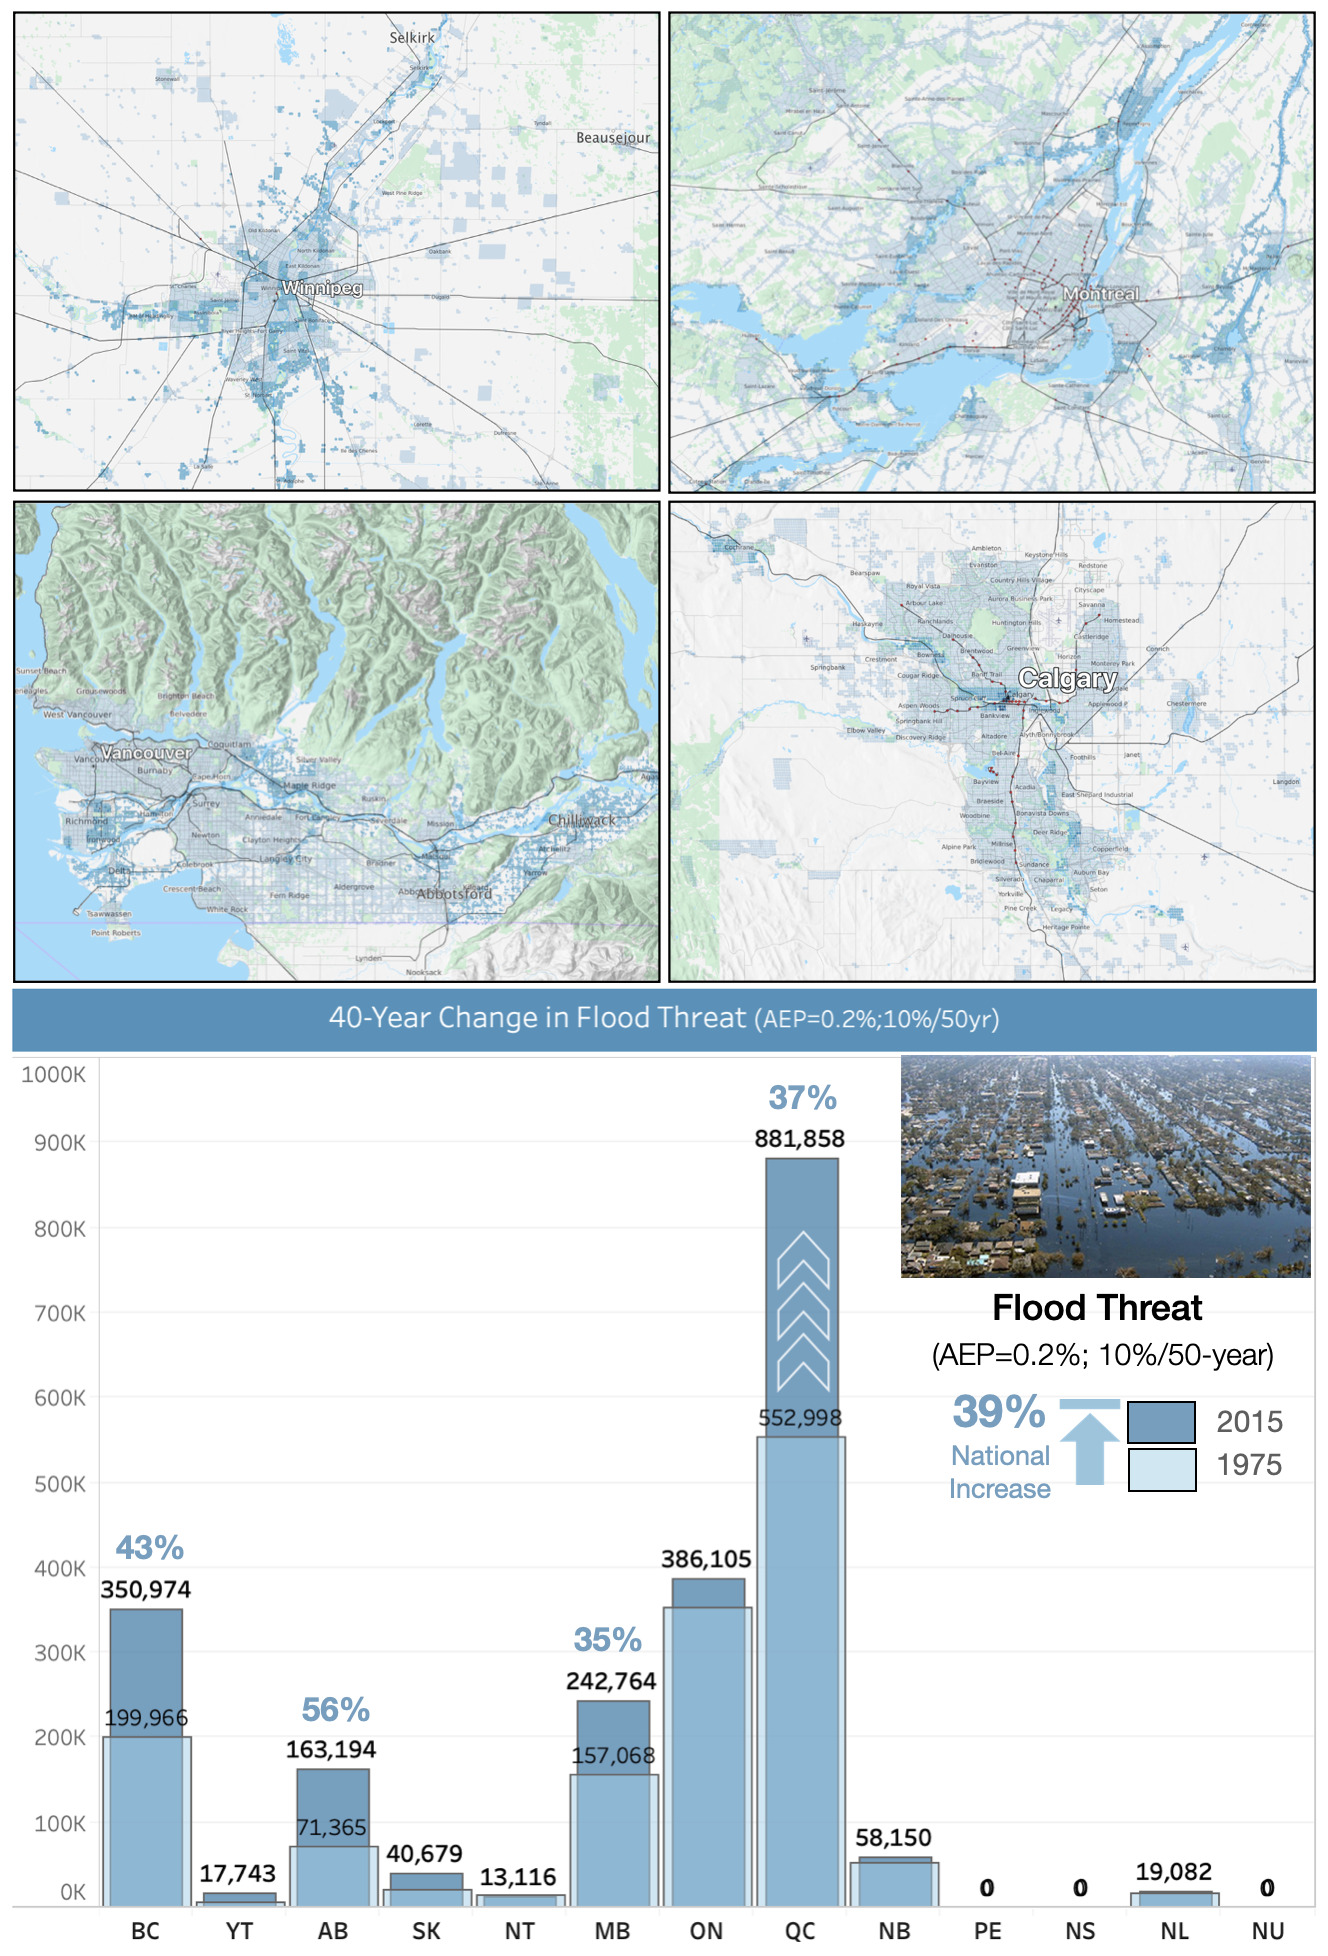
Hazard threat in the Halifax region is characterized by high damage potential with 111,840 buildings, 403,480 people and 80.7B $CAD susceptible to impacts associated with Category 4 winds. As with many areas across the Maritime Provinces, the threat is concentrated in primarily in rural and low-density residential settlements along the coast (~96,600 people) — areas that are susceptible to the impacts of wind and secondary hazards of severe flooding caused by rain and storm surge events accompanying severe storm events that are likely for a 10%/50-year time horizon. Medium and high-density neighbourhoods in the centre of Halifax represent a significantly smaller proportion of the overall threat with damage likely primarily within older low-rise structures that may not have been retrofitted to sustain the force of severe winds.
The hazard threat profile is very similar for St. John’s and surrounding regions of Newfoundland, both in terms of the overall numbers of buildings and people exposed to high damage potential, and the concentration of impacts in rural and low-density residential settlements along the coast. Although not reflected in our exposure model, there would likely be extensive damage to fishing vessels in harbours scattered along the coastline in Newfoundland and Nova Scotia (Rezaee, Pelot, and Finnis 2016) resulting in significant additional threats to life safety and the potential for additional financial losses to individual businesses and the commercial fishing industry more generally.
The urban centres of Saint John, Fredericton and smaller settlements situated along the Saint John River in western New Brunswick represent ~ 170,115 buildings, 461,470 people and more than 94B $CAD in capital assets that are susceptible to varying levels of damage related to severe wind and associated riverine flooding (Figure 40). This includes 119,830 buildings susceptible to Category 3 (considerable damage potential), 46,550 buildings susceptible to Category 2 wind and related flood hazards. In addition to direct physical impacts to buildings, winds associated with hurricane events over a 10%/50-year time horizon would also likely result in uprooting and breakage of trees causing additional damage and disruption to both power and transportation infrastructure. Although less severe, wind hazards along the St. Lawrence Seaway still pose a threat to both rural settlements and larger urban centres surrounding Quebec City. Overall, more than 225,685 buildings, 869,830 people and over 197B $CAD in capital assets are susceptible to low levels of damage and associated socioeconomic disruption.
While our assessment of hurricane hazard threat captures broad regional trends at a ~1 kilometre scale of resolution, there is potential to significantly refine the profile of hurricane risk in eastern Canada using engineering-based fragility functions that reflect performance characteristics for specific types of buildings. Outputs of these more detailed assessments would help identify hotspots of concern where there are higher concentrations of older wood frame buildings likely that would sustain the greatest levels of damage. These models would also provide additional resolution on the potential for injuries and household displacement associated with building damage, expected financial costs to repair and/or repair damage and the time required to recover from secondary disruptions to critical infrastructure services.
Earthquake
Canada is exposed to rare but potentially catastrophic earthquake events that have the potential for significant damage, loss of life and socioeconomic disruptions. Although less frequent than floods, wildfire and other hazards of concern, a single earthquake event has the potential for human and economic losses that exceed the combined effects of all disaster events experienced in Canada over the past 200 years (See Figure 42). The anticipated physical impacts and socioeconomic consequences of such an event near densely settled areas of British Columbia and Quebec would likely exceed levels of insurance coverage and federal emergency backstop measures currently in place and strain capacities for immediate response and functional recovery at all levels of government (Figure 43: Le Pan 2016)
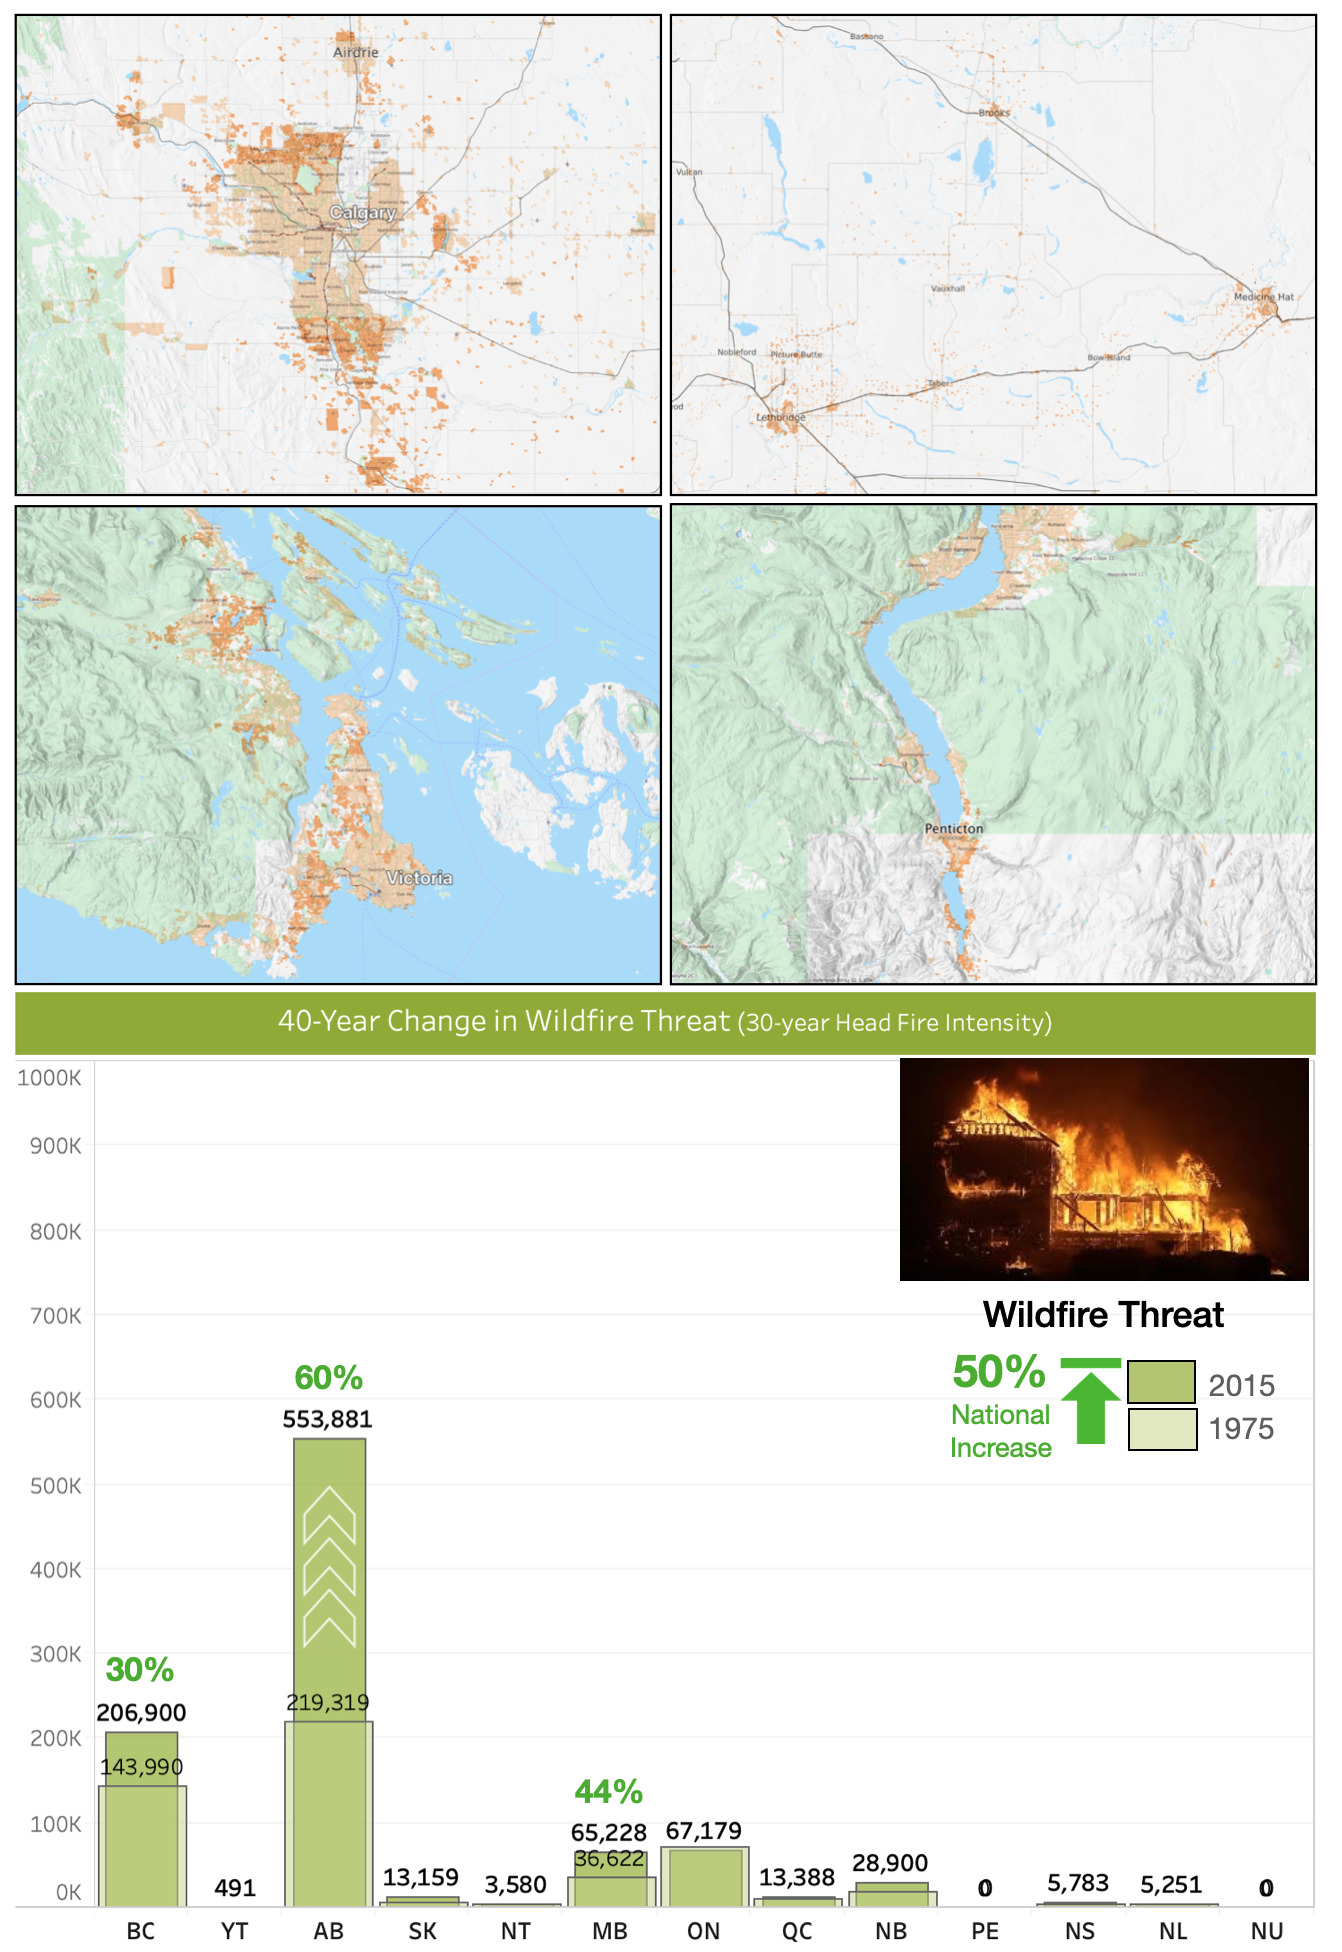
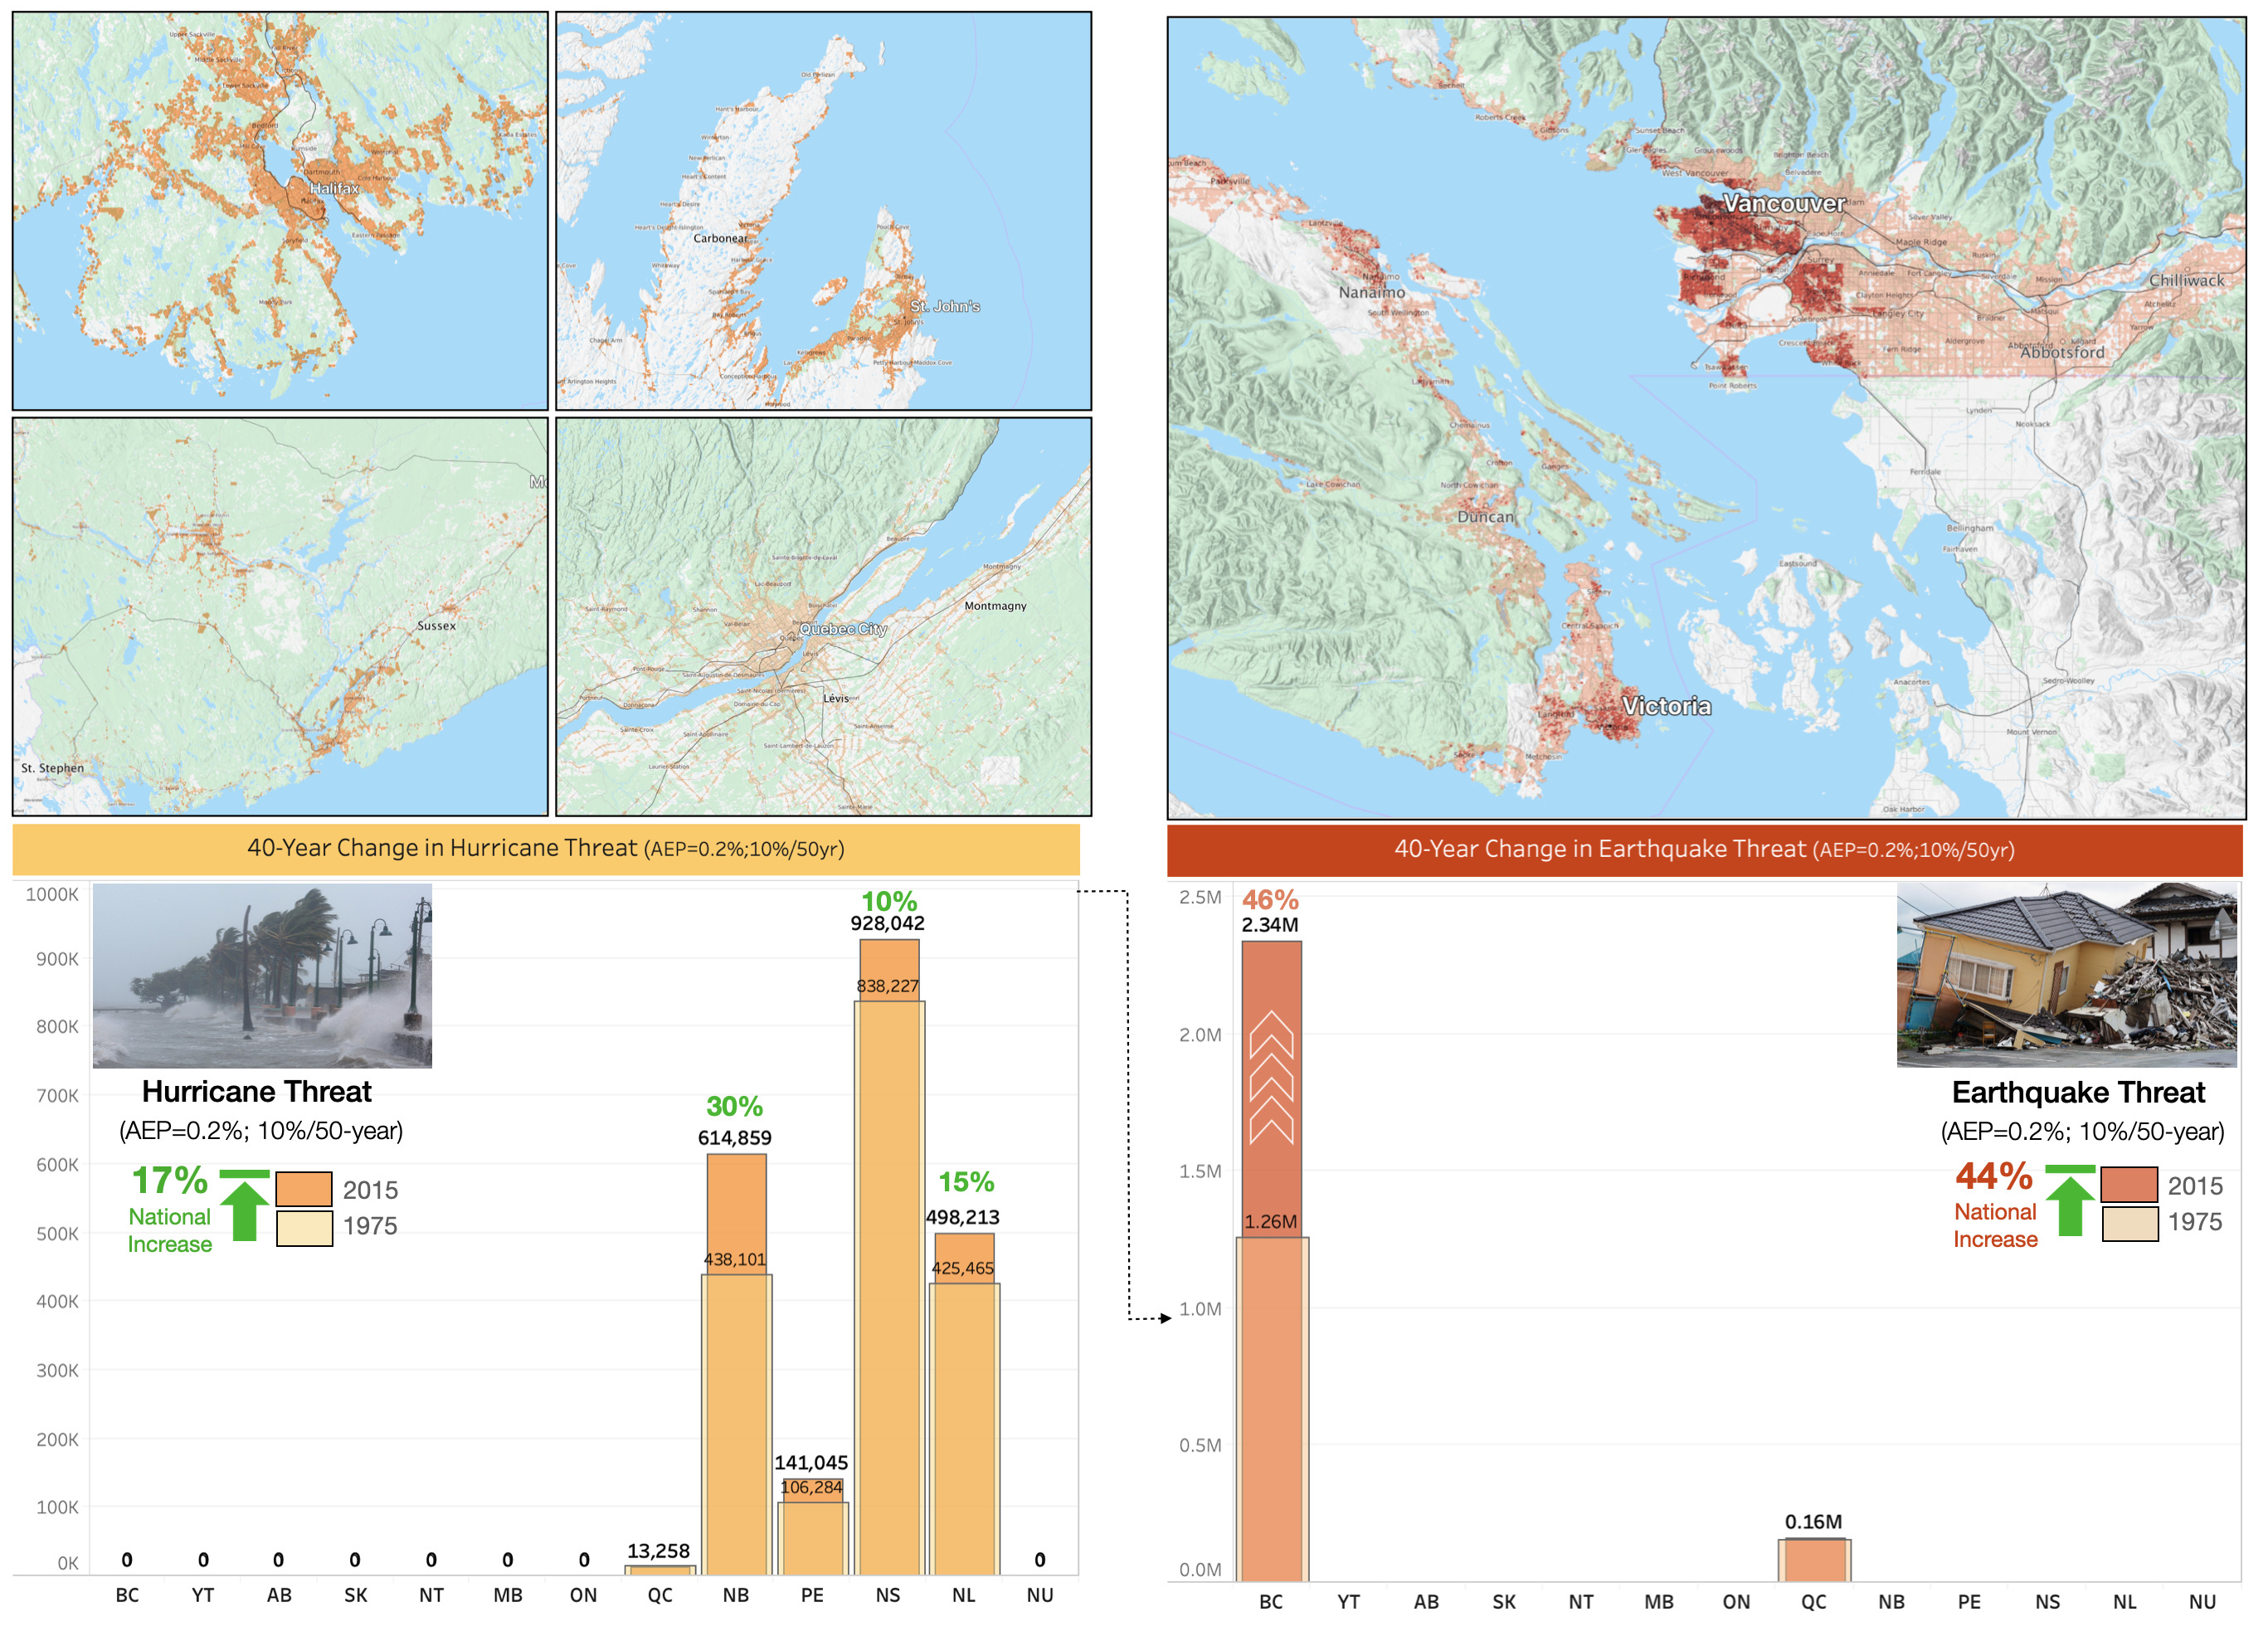
So called ‘Black Swan’ events, earthquakes share many of the same characteristics of impact and severe socioeconomic disruption that we have all now experienced as part of the Covid-19 pandemic. They are the consequence of infrequent but well understood natural processes resulting in disaster events that are not easily predicted but considered obvious by most in hindsight. The immediate physical impacts are amplified by cascading system failures and downstream consequences that can be significantly larger than those caused by the triggering event itself. In addition, the scale of impact and loss that can be expected for a major earthquake would disproportionally affect the most vulnerable members of society who already bear the greatest burden of risk for other hazard threats of concern in Canada.
Like the Greek myth of Damocles, who longed to sit at the king’s throne only to find a razor-sharp sword suspended above him on a fine thread, earthquakes represent a particular class of societal risk that can only be brought to light through foresight and modeling of known cause-effect relationships (Renn and Klinke 2004). We now have the capacity to model earthquake risk at a detailed level for all regions of Canada (Journeay et al. in prep.) and understand what can be expected from the experience of others who have lived through recent earthquake disasters in New Zealand, Chile and elsewhere in the world. Yet, without first-hand experience of a damaging earthquake in Canada, these ‘Black Swan’ events are still largely out-of-sight and out-of-mind for most Canadians.
Yet, there is no shortage of knowledge about earthquake hazards in Canada. We know from post-colonial settlement records that significant earthquake events of magnitude M5.0 or greater have occurred in Canada since the mid 1600’s (Cassidy et al. 2010; Lamontagne et al. 2018). Oral records of indigenous peoples living along the west coast of Canada extend the observed record of catastrophic earthquake and related tsunami events back to ~4,500 year BP (Finkbeiner 2015). As shown in Figure X, the majority of these historic events are located in (i) tectonically active zones along the western North American plate boundary and offshore regions of the Pacific plate; (ii) in distributed zones of crustal deformation throughout the Cordilleran regions of British Columbia, the Yukon and Northwest Territories; (iii) across the Arctic margin region of northern Canada, and; (iv) along reactivated zones of crustal weakness in the St. Lawrence Lowlands of Quebec and eastern Ontario, the northern Appalachian regions of New Brunswick, and offshore Atlantic regions of Canada.
The active plate boundary in western Canada has generated some of the world’s largest earthquakes with a magnitude of M8.0 and greater (see Figures 42). These include a M9.0 megathrust event along the Cascadia subduction zone offshore of Vancouver Island in 1700, a M8.2 crustal earthquake in the Yukatat Bay regions of the Yukon in 1899 (M8.2), and multiple dextral and oblique-slip rupture events (> M8.0) along the Queen Charlotte Fault between 1949 and 2012.
A second tier of damaging earthquake events of M6.5 to M7.7 are recorded in all major seismotectonic zones across Canada. These include: a M7.0 event in the Charlevoix region of Quebec in 1663. a series of M6.8 to M7.3 shallow events in the Cascadia region of southwest British Columbia between 1918 and 1946; a M7.2 event in the Grand Banks offshore region of Newfoundland in 1929; a M7.3 event in the Baffin Bay area of Nunavut in 1933; a series of M7.0 to M7.7 dextral and oblique slip ruptures along the Queen Charlotte Fault between 1929 and 1970; and a series of M6.6 to M6.9 events in the Nahanni region of the Northwest Territories in 1985.
Hazard Intensity
Earthquakes are generated by the sudden release of seismic energy along a fault zone — a break in the Earth’s crust across which rock masses are displaced through an iterative process of strain accumulation, rupture and displacement. The relative severity of an earthquake rupture is measured in terms of magnitude and/or intensity. Earthquake magnitude represents the amount of seismic energy released at the source of rupture, like the power output of a radio signal at its origin. Earthquake intensity reflects the seismic energy felt at a given location away from the source of rupture, like the strength of a radio signal recorded at a distant receiver location.
Seismic hazard intensity is measured using a combination of peak ground acceleration (PGA) and spectral acceleration (SA) values that reflect seismic energy experienced at particular location. Peak ground acceleration is the maximum seismic energy (force) experienced by a particle on the ground in response to both vertical displacement and horizontal shear during an earthquake event. Spectral acceleration measures the equivalent force experienced by a particle on a massless vertical rod having the same natural period of vibration as that of an engineered structure of variable height. Both measures provide a proxy for expected levels of damage during an earthquake event.
Ground motion intensities used in this study are based on a fully probabilistic seismic hazard model that is updated on a regular basis to inform seismic safety guidelines in the National Building Code of Canada (Adams et al. 2015b; Halchuk et al. 2014; Halchuk, Adams, and Allen 2015; Rogers et al. 2015). To ensure comparability with other hazard threats considered in this study, we use reported ground motion values representing the hazard contribution from earthquake events that are likely to occur within a 10%/50-year time horizon (~475 years; AEP-0.2%). Reported shaking intensities are referenced to average response characteristics of firm ground (site class C) and do not reflect the compounding effects of local site conditions in which layered geological units can result in the amplification or dampening of seismic energy as it travels through the uppermost layers of the Earth’s crust.
A complementary method of representing hazard potential using outputs of the national probabilistic seismic model is to calculate the likelihood of experiencing ground shaking intensities capable of causing different levels of damage and/or loss for a given planning horizon of interest (Onur and Seeman 2004). For example, in seismically active regions of eastern Ontario and Quebec, the 50-year likelihood of experiencing a damaging earthquake ranges from 3-5% along the St. Lawrence Lowland between Montreal and Quebec City. These probabilities increase to between 10% and 25% at the entrance of the St. Lawrence Seaway (See Figure 42).
The 50-year likelihood of a damaging earthquake in southwest Yukon and northwest British Columbia ranges from 18% near Haines Junction to more than 50% near the border with Alaska. In the Haida Gwaii region of central British Columbia, probabilities range from 25% in the Masset region to nearly 70% adjacent to the Queen Charlotte Fault; a zone of oblique strike-slip displacement along the boundary between North America and the Pacific Plate, similar to that of the San Andreas Fault in California. Hotspots of concern in southwest British Columbia include the Lower Fraser Valley region where the 50-year likelihood of a damaging earthquake ranges from 5% in the eastern portions of the river delta to as much as 18% in dense urban neighbourhoods of Metro Vancouver. The greatest likelihood of experiencing a damaging earthquake in this portion of the province is along the outer coast of Vancouver Island, where probabilities range from ~27% in the Capital regional District of Victoria to as much as 60%. Primary sources of seismic hazard in this region include large magnitude ‘megathrust’ ruptures along the Cascadia subduction zone, extensional faulting deep within the Juan de Fuca plate as it is subducted beneath the North American craton, and shallow crustal faults that accommodate shortening and oblique translation between the North American and Juan de Fuca Plates.
In addition to primary ground shaking hazards, earthquakes can trigger second-order hazards such as tsunami, liquefaction and seismically induced landslides — all of which have the potential to increase baseline levels damage and loss following the initial earthquake event. For purposes of this study, we consider only the effects of tsunami events that are triggered by megathrust earthquake events along the plate boundaries of the Pacific Plate.
A tsunami is an extremely large wave of water that can surge up to ~40 metres in height and inundate low-lying coastal areas causing massive loss of life and the destruction of everything in its path. Tsunamis are triggered primarily by earthquakes, but can also be caused by landslides, volcanic eruptions and the impact of meteorites into large bodies of water. Earthquake-triggered tsunami hazards are measured in terms of the area of land likely to be inundated by flood waters associated earthquake ruptures of variable magnitude occurring over a specified time horizon. Tsunami inundation areas used in this study are based on a global scale probabilistic tsunami hazard assessment carried out by the Norwegian Geotechnical Institute and Geoscience Australia in support of the 2015 Global Assessment Report (Løvholt et al. 2015). The study incorporates a catalog of global earthquake source zone models to estimate maximum run-up heights and inundation footprints for tsunami events that are likely to occur within a 10%/50-year time horizon (~475 years). Outputs of the tsunami hazard model for Canada provide a first-order approximation of hazard intensity (run-up heights) and land areas that are likely to be affected.
Damage Potential
Outputs of a national seismic risk assessment are now available at the census dissemination area for all regions in Canada (Journeay et al. in prep.). Performance measures include expected levels of damage for buildings of varying types and quality of construction as well as corresponding economic losses over multiple time horizons. Risk metrics are used to establish a base of evidence to inform planning and policy development at the community scale in accordance with regulatory guidelines established for both building safety and economic security (OSFI 2013b, 2013a; NBCC 2015; Fathi-Fazl et al. 2018; Fathi-Fazl, Cai, and Cortés-Puentes 2019). A complementary suite of deterministic earthquake risk scenarios provides additional insights on cause-effect relationships and expected levels of injury, loss of life and socioeconomic disruption for representative seismic source zones across Canada (Hobbs et al., in prep).
These detailed earthquake risk models make use of engineering-based fragility functions that relate the intensity of ground shaking at any given location to the expected probabilities of damage for building archetypes that represent more than 9.2 million homes and businesses across Canada (Silva et al. 2014; Martins and Silva 2020; Silva et al. 2020). Physical vulnerability and consequence functions are used to model dimensions of public safety and socioeconomic security using a framework of indicators that align with broader policy goals and objectives established as part of the Sendai Framework for Disaster Risk Reduction.
In order to establish a common baseline for comparing levels of hazard threat across multiple perils, earthquake threat is assessed here in a more general way with an impact scale that relates the intensity of ground shaking to expected levels of damage and socioeconomic disruption. The Modified Mercalli Index (MMI) is a graduated scale that describes the effects of an earthquake in terms of what people have felt or are likely to experience on the ground, and the expected levels of damage to buildings, engineered structures and natural features (See Figure 44). Each level of the MMI scale is correlated with ground shaking intensity values (PGA and PGV) using empirical relationships developed as part of the USGS ShakeMap project (Wald et al. 2006; Worden et al. 2012) and validation with earthquake disaster events worldwide as part of the ShakeMap and PAGER programs run by the US Geological Survey (Wald et al. 2006; Earle et al. 2009).
MMI intensity values of I to IV reflect an earthquake event that is only barely felt with little or no capacity for structural damage. MMI intensity values of V to VII reflect a moderate ground-shaking level that is felt by all and in which there is potential for slight or moderate damage to buildings that are badly designed and/or poorly built. MMI values of VIII to IX reflect proximity to a major earthquake event in which the level of ground shaking is sufficient to cause general alarm and/or panic, and in which there is potential for severe or complete damage to older buildings, and collapse of brittle masonry and concrete structures that are not designed to withstand the lateral forces associated with chaotic earthquake ground motions.
Hazard Threat
Although Canadians have not experienced the effects of a catastrophic earthquake in the last several hundred years, the threat of damage and significant social disruption is significantly higher than for any of the other hazards we have investigated up to this point (See Figure 45). Results of our analysis indicate that more than half of all Canadians (19.8M people; 56.3% of the population) are exposed to ground shaking hazards capable of causing some level of damage and/or disruption (Figure X). The majority of these people (17.2M people) are situated in regions of low and moderate damage potential in the St. Lawrence Lowland region of Quebec and Ontario. Hotspot regions of greatest concern are densely populated urban centres of Vancouver and Victoria in the southern Georgia Basin region of southwest British Columbia where more than 2.4 million people (95% of the population) are exposed to considerable and high levels of damage potential.
The Greater Vancouver region has the highest concentration of assets at risk with over 2.76M people, ~536,250 buildings and 756.7B $CAD in financial assets exposed to moderate and considerable levels of damage for earthquakes that are expected over a 10%/50-year time horizon (Figure 46A). The majority of these assets (65%) are concentrated in regions of considerable damage potential in southwest portions of the region (Vancouver, Burnaby, Richmond and Delta) with roughly equal distributions across low, medium and high-density residential neighbourhoods. Areas of particular concern include the downtown Vancouver business district, arterial corridors connecting Burnaby, Surrey and Richmond and adjacent regions of North Vancouver where the likelihood of experiencing considerable damage in a major earthquake ranges between 15-18% over a 50-year time horizon.
The Capital regional district of Southern Vancouver Island ranks second in terms of assets at risk with ~384,590 people (103,410 buildings; 130.7B $CAD) exposed to levels of considerable damage potential (Figure 46B). The majority of people and capital assets are situated in low-density residential neighbourhoods on the Saanich Peninsula and to the southwest of Victoria in the cities of Langford, Colwood, Metchosin and Sooke. However, more than a third of all assets at risk are concentrated in medium and high-density residential and commercial neighbourhoods in the downtown core of Victoria, many of which are characterized by higher proportions of older concrete and unreinforced masonry buildings that are particularly susceptible to earthquake damage. The likelihood of experiencing a damaging earthquake in this region is ~27% over a 50-year time horizon. This is roughly equivalent to the lifetime odds of dying from a serious pedestrian accident or fall (National Safety Council 2018).
The greater Montreal region has the highest concentration of assets exposed to moderate levels of damage in Canada with 3.63 million people, ~691,715 buildings and ~816.8B $CAD potentially in harm’s way (Figure 46C). The majority of these assets (~60%) are concentrated in high-density residential neighbourhoods in the downtown core and in neighbouring regions of Longueuil and Laval. As in Victoria, the primary concern is in older residential and commercial neighbourhoods with higher proportions of older unreinforced masonry buildings. The likelihood of experiencing an earthquake capable of causing significant structural damage is estimated to be ~5% over a 50-year time horizon.
Patterns of hazard threat are similar in the Quebec City region where ~922,890 people, 246,070 buildings and 206.2B $CAD are exposed to moderate levels of damage potential (Figure 46D). The majority of these assets (~63%) are concentrated in low density residential suburban regions with the remainder distributed between medium and high-density neighbourhoods in the downtown core. Although similar in damage profile to Montreal, the Quebec City region is twice as likely to experience a damaging earthquake with 10-25% chance of occurrence over a 50-year time horizon.
These profiles of urban risk for earthquake and related tsunami hazards underscore the challenge of managing seismic risk at a national scale in Canada. The scope and severity of threat are greater than for any of the other hazard considered in this study, yet there is relatively little understanding of the potential impacts and consequences among those who are in a position to do something about it. While we continue to focus efforts on reducing the impacts of more frequent but less severe hazards, the potential for future catastrophic earthquake events looms on the horizon.
Summary and Discussion
Outputs of this study are intended to provide a baseline for situational awareness of multi-hazard threats at the community level in Canada, and to identify hotspot regions of concern that may warrant more detailed follow-up studies. The framework is based on a detailed physical exposure model for Canada that utilizes a harmonized suite of impact scales to relate hazard intensity values at a given location with expected impacts from future flood, wildfire, hurricane, earthquake and tsunami events. With the exception of wildfire, all probabilistic hazard intensity values are assessed for larger magnitude events that are likely to occur over a 500-year time horizon (AEP=0.2%;10%/50-year) to establish a common baseline for comparison. The vulnerability of physical assets within the wildland-urban-interface (WUI) is assessed using 30-year mean head fire intensity values that reflect the general likelihood of experiencing future wildfire events based on fuel availability, ignition potential, landscape variables and future weather conditions that will determine the capacity of a forest fire to spread over the landscape.
Spatial interactions between hazard intensity, damage potential and the susceptibility of people and critical assets are explored using bivariate choropleth maps that provide important insights on cause-effect relationships and patterns of hazard threat at the community level. Although we are not able to model details of probable damage and loss for specific assets within the portfolio (e.g., physical risk), outputs of our national threat assessment can be used to identify hotspots of concern at local and regional scales.
Each region of Canada is characterized by a unique profile of hazard threat that reflects underlying characteristics of the physical landscape and patterns of human settlement that have evolved over time (Figure 47). Earthquakes and hurricanes are controlled by large scale geophysical and meteorological processes that affect large portions of the country. More than half of Canada’s population (56%; 19.8 million people) is exposed to earthquake hazards with an additional 11.7 million people exposed to hurricane wind hazards along the eastern seaboard. Areas of greatest concern include urban centres of southwest British Columbia where ~2.34 million people are exposed to damaging earthquake events that are likely to occur over a 500-year time horizon, and in the St. Lawrence Lowland region of Quebec where an additional 190,000 people are exposed. Similarly, severe wind hazards affect nearly one-third of Canada’s population with Category 3 and 4 hurricane force winds concentrated primarily in the maritime provinces of New Brunswick, Prince-Edward Island, Nova Scotia and Newfoundland where 2.16 million people are in the path of future severe storm events.
Although triggered by large-scale meteorological processes, riverine flood and wildfire threats are controlled by more localized landscape and land cover conditions that affect a fewer number of people overall. For example, wildfire hazards are present in most regions of Canada, but the effects on the built environment are concentrated primarily within the wildland-urban-interface area where 3.6 million people (10.3% of population) are exposed to direct impact and/or associated socioeconomic disruption. However, the proportion of those likely to be impacted by more severe wildfire hazards is almost 30% of the total exposed population. Areas of greatest hazard threat are in southern Alberta where ~635,000 people are exposed to severe wildfire hazards, and in urban fringe and rural communities in British Columbia where an additional ~220,000 people are at risk. Similarly, riverine flood hazards are present in most areas of Canada but affect a relatively small percentage of the overall national population (8%; 2.86 million people). However, the proportion of people susceptible to more severe flood threats is the highest overall with nearly 65% of those exposed likely to sustain significant levels of damage in future flood events.
Disaster Risk Trends
Understanding Canada’s profile of disaster risk requires more than just a simple accounting to who and what are in harm’s way. While the outputs of this study provide an important baseline for measuring the relative threat of flood, wildfire, hurricanes and earthquake hazards in Canada, it is the underlying social and economic drivers of risk that urgently need our attention if we are to change the outcome of future disaster events. These include choices we make as local and regional governments about managing the pressures of growth and development in areas exposed to severe hazard threats (exposure); the choices we make as individuals about whether or not to invest in mitigation and adaptation measures that will reduce overall levels of threat in our communities (physical vulnerability); and the choices we make collectively about how to safeguard those members of society who typically bear the greatest burden of risk in a disaster event (social vulnerability).
The collective impacts of global disasters have increased exponentially in the last 50 years and appear to be outpacing our ability to flatten the curve of future risk (GFDRR 2016; McGlade et al. 2019). As in other parts of the world, the primary driver of disaster risk in Canada is increased exposure caused by rapid urbanization and the concentration of people and assets in higher density neighbourhoods that are susceptible to a range of hazard threats. To better understand these trends, we explore temporal changes in hazard threat over four time epochs (1975, 1990, 2000 and 2015) using population estimates and land use change metrics developed as part of the Global Human Settlement Layer (Pesaresi et al. 2016). Our work builds on results reported in the 2017 Atlas of the Human Planet (Pesaresi et al. 2018) but with a focus on changes in hazard threat that are relevant at a regional scale in Canada (See Figures X and X).
Flood threat has increased overall by 39% with more than 665,000 people added to active floodplains in all regions of Canada since 1975 (Figure 48). The largest increases are in Quebec where 328,86 new residents were added to already vulnerable floodplain areas along the St. Lawrence, Richelieu and Saguenay rivers. Other areas that have experienced large increases in the overall number of people exposed to flood hazards include the lower Fraser River area of southwest British Columbia (151,000), the Bow River in Alberta (91,830) and the Assiniboine and Red rivers of Manitoba (85,700). Rates of change are highest in Alberta (56%) and British Columbia (43%).
Wildfire threat has almost doubled in the last forty years with 442,490 additional people moving into the wildland-urban interface surrounding larger cities and towns experiencing rapid growth (Figure 48). Most of this growth (334,560; ~75% of total) occurred in urban fringe areas of southern Alberta (334,560) with an additional ~63,000 people added in the Okanagan and southern Vancouver Island regions of Vancouver. Rates of change are highest in Alberta (60%), Manitoba (44%) and British Columbia (30%).
Changes in hurricane threat have been more modest over the last forty years (~17%) with 372,100 additional people living in areas susceptible to severe wind hazards (Figure 49).. This includes a 30% increase in hazard threat for both rural and urban settlements in New Brunswick, a 10% increase in Nova Scotia and a 15% increase in Newfoundland-Labrador. Though less pronounced than urban growth in hurricane prone areas of the United States, the overall threat remains high across the maritime provinces with over 2.16 million people susceptible to severe wind hazards, including many remote fishing towns and villages scattered along the coast.
Earthquake threat is the most significant of all hazards in Canada and has been steadily increasing since 1975 (Figure 49). Unlike other hazard types, seismic threat is concentrated primarily in major urban centres of southwest British Columbia where more than 1 million people have moved into areas that are susceptible to significant damage and disruption in the event of a future earthquake. Areas of highest growth have been in the Greater Vancouver region (Vancouver, Burnaby, Surrey, Richmond and Delta), the city of Victoria and surrounding regions along the southeast coast of Vancouver Island where the chances of experiencing a damaging earthquake in the next 50 years ranges between 15% to as much as 27%.
Current trends in disaster risk are likely to continue escalating at current rates or higher into the future. While we can improve our understanding of natural hazards and risk through more detailed models at local and regional scales, the bigger challenge will be in building capabilities and incentives to incorporate this information into the community development process so that it becomes part of the pathway toward a more sustainable future.
References
-
Adams, J., T. Allen, S. Halchuk, and M. Kolaj. 2019. 'Canada’s 6th Generation Seismic Hazard Model, as Prepared for the 2020 National Building Code of Canada. 12th Can. Conf', Earthquake Engineering.
-
Adams, John, Stephen Halchuk, Trevor Allen, and Gary Rogers. 2015a. "Canada’s 5th Generation Seismic Hazard Model, as Prepared for the 2015 National Building Code of Canada." In 11th Canadian Conference on Earthquake Engineering (11CCEE), 11. Victoria, BC.———. 2015b. "Fifth Generation (2015) Seismic Hazard Model for Southwest British Columbia." In 11th Canadian Conference on Earthquake Engineering (11CCEE), 11. Victoria, BC.
-
Agriculture and Agri-Foods Canada. 2015. "ISO 19131 – Land Use Data Product Specifications." In, 14.
-
Alexander, M.E., B.J. Stocks, and B.D Lawson. 1996. "The Canadian Forest Fire Danger Rating System." In Initial Attack - the magazine for wildfire managment. Bombardier Inc., Canadair, Montreal, PQ, 4. Montreal, PQ.
-
Alexander, Martin E. 1982. 'Calculating and interpreting forest fire intensities', Canadian Journal of Botany, 60: 349-57.
-
Alfieri, Lorenzo, Peter Burek, Emanuel Dutra, Blazej Krzeminski, David Muraro, Jutta Thielen, and Florian Pappenberger. 2013. 'GloFAS–global ensemble streamflow forecasting and flood early warning', Hydrology and Earth System Sciences, 17: 1161-75.
-
Atwater, B.F., S. Musumi-Rokkaku, K. Satake, Y. Tsuji, K. Ueda, and D.K. Yamaguchi. 2005. 'The orphan tsunami of 1700', U.S. Geological Survey Professional Paper 1707: 133.
-
Bardales, Fernando Jose Szasdi, Nima Masoudvaziri, Negar Elhami Khorasani, and Kang Sun. 2019. 'Understanding Fire Spread in Wildland Urban Interface Communities'.
-
BC Wildfire Service. 2021. "Major Historical Wildfires." In The BC Wildfire Service. Victoria BC.
-
Becker, J, D Johnston, H Lazrus, G Crawford, and D Nelson. 2008. 'Use of traditional knowledge in emergency management for tsunami hazard', Disaster Prevention and Management, 17: 488-502.
-
Beverly, Jen, Geoff Braid, Liz Chapman, Stuart Kelm, Wendell Pozniak, Laura Stewart, and Kelly Johnston. 2018. "FireSmart Wildfire Exposure Assessment: A Planning Tool for Identifying Values at Risk and Prioritizing mitigation Effort." In FireSmart, edited by University of Alberta, 25. University of Alberta.
-
Beverly, Jennifer L., P. Bothwell, J. C. R. Conner, and E. P. K. Herd. 2010. 'Assessing the exposure of the built environment to potential ignition sources generated from vegetative fuel', International Journal of Wildland Fire, 19: 299-313.
-
Beverly, Jennifer L., and Peter Bothwell. 2011. 'Wildfire evacuations in Canada 1980–2007', Natural Hazards, 59: 571-96.
-
Bierwagen, Britta G. 2005. 'Predicting ecological connectivity in urbanizing landscapes', Environment and Planning B: Planning and Design, 32: 763-76.
-
Bloemendaal, Nadia, Hans De Moel, Sanne Muis, Ivan D. Haigh, and Jeroen C. J. H. Aerts. 2020. 'Estimation of global tropical cyclone wind speed probabilities using the STORM dataset', Scientific data, 7: 1-11.Blong, Russell. 2003a. 'A new damage index', Natural Hazards, 30: 1-23.———. 2003b. 'A review of damage intensity scales ', Natural Hazards, 29: 57-76.
-
Burby, Raymond J. 1998. Cooperating with nature; confronting natural hazards with land-use planning and sustainable communities (Joseph Henry Press: Washington, DC).
-
Byram, G.M. 1959. 'Combustion of forest fuels. .' in K.P. Davis (ed.), Forest fire: control and use (McGraw-Hill: New York).
-
Cassidy, J.F., G.C. Rogers, M. Lamontagne, S. Halchuk, and John Adams. 2010. 'Canada’s Earthquakes: 'The Good, the Bad and the Ugly'', Geoscience Canada, 37: 1-16.
-
CIFFC. 2019. "CIFFC Canada Report 2019." In, edited by Canadian Interagency Forest Fire Centre Inc.
-
Clague, John J., Nicholas J. Roberts, Brendan Miller, Brian Menounos, and Brent Goehring. 2021. 'A huge flood in the Fraser River valley, British Columbia, near the Pleistocene Termination', Geomorphology, 374: 107473.
-
Cohen, Jack. 2008. 'The wildland-urban interface fire problem: A consequence of the fire exclusion paradigm', Forest History Today. Fall: 20-26.: 20-26.
-
Colle, Brian A., James F. Booth, and Edmund K. M. Chang. 2015. 'A review of historical and future changes of extratropical cyclones and associated impacts along the US East Coast', Current Climate Change Reports, 1: 125-43.
-
Colle, Brian A., Zhenhai Zhang, Kelly A. Lombardo, Edmund Chang, Ping Liu, and Minghua Zhang. 2013. 'Historical evaluation and future prediction of eastern North American and western Atlantic extratropical cyclones in the CMIP5 models during the cool season', Journal of Climate, 26: 6882-903.
-
Davis, James B. 1988. 'The wildland-urban interface: what it is, where it is and its fire management problems', General technical report-US Department of Agriculture, Forest Service, Intermountain Research Station (USA).
-
De Groeve, Tom, K. Poljansek, and L. Vernaccini. 2015. 'Index for risk management-INFORM', JRC Sci Policy Reports—Eur Comm, 96: 636388.
-
Delmonaco, G., C. Margottini, and D. Spizzichino. 2007. "ARMONIA methodology for multi-risk assessment and the harmonisation of different natural risk maps. Deliverable 3.1. 1, ARMONIA." In.
-
Desai, B., A. Maskrey, Pascal Peduzzi, Andréa De Bono, and Christian Herold. 2015. 'Making development sustainable: the future of disaster risk management, global assessment report on disaster risk reduction'.
-
Dore, Mohammed H.I. 2003. 'Forecasting the conditional probabilities of natural disasters in Canada as a guide for disaster preparedness', Natural Hazards, 28: 249-69.
-
Dottori, Francesco, Lorenzo Alfieri, Peter Salamon, Alessandra Bianchi, Luc Feyen, and Feyera Hirpa. 2016. "Flood hazard map of the World - 500-year return period. European Commission, Joint Research Centre (JRC) Dataset." In.
-
Dottori, Francesco, Peter Salamon, Alessandra Bianchi, Lorenzo Alfieri, Feyera Aga Hirpa, and Luc Feyen. 2016. 'Development and evaluation of a framework for global flood hazard mapping', Advances in water resources, 94: 87-102.
-
Earle, Paul S., David J. Wald, Kishor S. Jaiswal, Trevor I. Allen, Michael G. Hearne, Kristin D. Marano, Alicia J. Hotovec, and Jeremy M. Fee. 2009. 'Prompt Assessment of Global Earthquakes for Response (PAGER): A system for rapidly determining the impact of earthquakes worldwide', US Geological Survey Open-File Report, 1131: 15.
-
Etkin, D., C. E. Haque, and G. R. Brooks. 2003. An Assessment of natural hazards and disasters in Canada (Kluwer Academic).Etkin, David (ed.)^(eds.). 2010. Canadians at risk: Our exposure to natural hazards (Institute for Catastrophic Loss Reduction (ICLR): Toronto, Ontario).Fathi-Fazl, R., Z. Cai, and L. Cortés-Puentes. 2019. 'NEW SEISMIC RISK SCREENING TOOL FOR EXISTING BUILDINGS IN CANADA'.
-
Fathi-Fazl, Reza, Eric Jacques, Zhen Cai, Bessam Kadhom, Bassem Saassouh, and Dariush Motazedian. 2018. 'Development of a preliminary seismic risk screening tool for existing buildings in Canada', Canadian Journal of Civil Engineering, 45: 717-27.
-
Federal Emergency Management Agency. 2006. "HAZUS-MH MR2 hurricane model user’s manual." In. Washington, DC USA: Federal Emergency Management Agency.
-
Finkbeiner, Ann. 2015. 'The great quake and the great drowning', Hakai Magazine.
-
Flannigan, Mike D., Meg A. Krawchuk, William J. de Groot, B. Mike Wotton, and Lynn M. Gowman. 2009. 'Implications of changing climate for global wildland fire', International Journal of Wildland Fire, 18: 483-507.
-
Fraser Basin Council. 2016. "Lower Mainland Flood Management Strategy: Phase 1 Summary Report." In, edited by Fraser Basin Council, 40. Vancouver, BC: Fraser Basin Council.
-
Friedland, J., H. Cheng, and A. Peleshok. 2014. 'Water damage risk and Canadian property insurance pricing', Canadian Institute of Actuaries, Ottawa. Prepared by KPMG.
-
GFDRR. 2016. "The making of a riskier future: How our decisions are shaping future disaster risk." In, 166. Global Facility for Disaster Reduction and Recovery.
-
Golnaraghi, Maryam, Jason Thistlethwaite, Daniel Henstra, and Craig Stewart. 2020. "Flood Risk Management in Canada: Building flood resilience in a changing climate." In, edited by The Geneva Association, 66. Zurich: The Geneva Association—International Association for the Study of Insurance Economics.
-
Gralewicz, Nicholas J., Trisalyn A. Nelson, and Michael A. Wulder. 2012. 'Factors influencing national scale wildfire susceptibility in Canada', Forest Ecology and Management, 265: 20-29.
-
Greiving, Stefan, Mark Fleischhauer, and Sylvia Wanczura. 2006. 'Management of natural hazards in Europe: The role of spatial planning in selected EU member states', Journal of Environmental Planning and Management, 49: 739 - 57.
-
Grossi, P, H Kunreuther, and CC Patel. 2005. Catastrophe modeling: a new approach to managing risk (Springer).
-
Halchuk, Stephen, Trevor Allen, John Adams, and Gary Rogers. 2014. "Fifth Generation Seismic Hazard Model Input Files as Proposed to Produce Values for the 2015 National Building Code of Canada." In.
-
Halchuk, Stephen C., John E. Adams, and Trevor I. Allen. 2015. "Fifth Generation Seismic Hazard Model for Canada: Grid values of mean hazard to be used with the 2015 National Building Code of Canadav." In.
-
Hirsch, Kelvin G. 1996. "Canadian Forest Fire Behavior Prediction (FBP) System: user’s guide." In, 134. Victoria, BC Canada: Natural Resources Canada.
-
Hirsch, Kelvin G., and P. Fuglem. 2006. Canadian Wildland Fire Strategy: background syntheses, analyses, and perspectives.
-
Huizinga, Jan, Hans de Moel, and Wojciech Szewczyk. 2017. "Global flood depth-damage functions: Methodology and the database with guidelines." In, edited by EU Joint Research Commission, 114. EU Joint Research Commission.
-
Hunter, Alasdair, David B. Stephenson, Theo Economou, Mark Holland, and Ian Cook. 2016. 'New perspectives on the collective risk of extratropical cyclones', Quarterly Journal of the Royal Meteorological Society, 142: 243-56.
-
Johnston, Lynn M., and Mike D. Flannigan. 2018. 'Mapping Canadian wildland fire interface areas', International Journal of Wildland Fire, 27: 1-14.
-
Johnston, Lynn M., Xianli Wang, Sandy Erni, Stephen W. Taylor, Colin B. McFayden, Jacqueline A. Oliver, Chris Stockdale, Amy Christianson, Yan Boulanger, and Sylvie Gauthier. 2020. 'Wildland fire risk research in Canada', Environmental Reviews, 28: 164-86.
-
Journeay, J Murray, Anirudh Rao, Vitor Silva, Tiegan Hobbs, Michal Kolaj, Marco Pagani, Kendra Johnson, and Michele Simionato. in prep. "A profile of seismic risk in Canada." In Geological Survey of Canada Open File, edited by Natural Resources Canada. Ottawa, Ontario Canada: Natural Resources Canada.
-
Kappes, Melanie S., Margreth Keiler, Kirsten von Elverfeldt, and Thomas Glade. 2012. 'Challenges of analyzing multi-hazard risk: a review', Natural Hazards, 64: 1925-58.
-
Kelman, M. C. 2015. "A preliminary volcanic ash fall susceptibility map of Canada. Geological Survey of Canada, Open File 7679." In, 100.
-
Kirschbaum, Dalia, and Thomas Stanley. 2018. 'Satellite‐based assessment of rainfall‐triggered landslide hazard for situational awareness', Earth’s future, 6: 505-23.
-
Klein, Johannes, Stefan Greiving, and Jaana Jarva. 2006. "Integrated natural risk legend and standard for harmonized risk maps for land use planning and management." In Armonia Project. Dortmund, Germany.
-
Knutson, Thomas R., John L. McBride, Johnny Chan, Kerry Emanuel, Greg Holland, Chris Landsea, Isaac Held, James P. Kossin, A. K. Srivastava, and Masato Sugi. 2010. 'Tropical cyclones and climate change', Nature geoscience, 3: 157-63.
-
Lamontagne, M., S. Halchuk, J.F. Cassidy, and G.C. Rogers. 2018. "Significant Canadian earthquakes 1600-2017." In Geological Survey of Canada Open File 8285, 37. Ottawa: Geological Survey of Canada.
-
Le Pan, Nicholas. 2016. "Fault Lines: Earthquakes, Insurance, and Systemic Financial Risk." In, edited by C.D. Howe Institute, 24. C.D. Howe Institute.
-
Lee, B. S., M. E. Alexander, B. C. Hawkes, T. J. Lynham, B. J. Stocks, and P. Englefield. 2002. 'Information systems in support of wildland fire management decision making in Canada', Computers and Electronics in Agriculture, 37: 185-98.
-
Leonowicz, A. 2006. 'Research on two-variable choropleth maps as a method for portraying geographical relationships', Geografija, 42: 33-7.
-
Long, Alan J., and Cotton K. Randall. 2004. Wildfire risk assessment guide for homeowners in the southern United States (School of Forest Resources and Conservation, University of Florida).
-
Løvholt, Finn, Sylfest Glimsdal, Helge Smebye, Jonathan Griffin, and Gareth Davis. 2015. "UNISDR Global Assessment Report 2015 GAR15: Tsunami methodology and result overview." In, 76. Norwegian Geotechnical InsitituteGeoscience Australia.
-
MacEachren, Alan M., and Menno-Jan Kraak. 2001. 'Research challenges in geovisualization', Cartography and Geographic Information Science, 28: 3-12.
-
Mamuji, Aaida A., and Jack L. Rozdilsky. 2019. 'Wildfire as an increasingly common natural disaster facing Canada: understanding the 2016 Fort McMurray wildfire', Natural Hazards, 98: 163-80.
-
Maranghides, Alexander, and William Mell. 2013. "Framework for Addressing the National Wildland Urban Interface Fire Problem – Determining Fire and Ember Exposure Zones using a WUI Hazard Scale. NIST Technical Note 1748." In, edited by NIST, 26. NIST.
-
Maranghides, Alexander, and William E. Mell. 2009. A case study of a community affected by the Witch and Guejito Fires (National Institute of Standards and Technology. Building and Fire Research …).
-
Margottini, Claudio, Scira Menoni, Giuseppe Delmonaco, and Adriana Galderisi. 2008. "Land use planning and management in hazardous areas: findings and perspectives for the future proposed by the Armonia project." In Armonia Project Report Series: Contract No: 511208.
-
Marin-Ferrer, M., L. Vernaccini, and K. Poljansek. 2017. "INFORM Index for Risk Management: Concept and Methodology." In, edited by UN Joint Research Centre (JRC), 90.Martins, Luís, and Vítor Silva. 2020. 'Development of a fragility and vulnerability model for global seismic risk analyses', Bulletin of Earthquake Engineering: 1-27.
-
McGlade, J., G. Bankoff, J. Abrahams, S. J. Cooper-Knock, F. Cotecchia, P. Desanker, W. Erian, E. Gencer, L. Gibson, and S. Girgin. 2019. "Global Assessment Report on Disaster Risk Reduction 2019." In.: UN Office for Disaster Risk Reduction.
-
Menezes, Charlene, and Sarah North. 2016. "Lower Mainland Flood Managemenet Strategy-Project 2: Regional Assessment of Flood Vulnerability." In, edited by Fraser Basin Council, 326. Vancouver BC: Fraser Basin Council.
-
Mileti, D. 1999. Disasters by design: a reassessment of natural hazards in the United States (Joseph Henry Press: Washington, DC).
-
Mileti, D., and Julie L. Gailus. 2005. 'Sustainable development and hazard mitigaiton in the United States: disasters by design revisited', Mitigation and Adaptation Strategies for Global Change, 10: 491-504.
-
Mohanty, Mohit P., and Slobodan P. Simonovic. 2021. 'Understanding dynamics of population flood exposure in Canada with multiple high-resolution population datasets', Science of The Total Environment, 759: 143559.
-
Montello, Daniel R. 2002. 'Cognitive map-design research in the twentieth century: Theoretical and empirical approaches', Cartography and Geographic Information Science, 29: 283-304.
-
Moudrak, N., B. Feltmate, H. Venema, and H. Osman. 2018. 'Combating Canada’s Rising Flood Costs: Natural infrastructure is an underutilized option. Prepared for Insurance Bureau of Canada. Intact Centre on Climate Adaptation, University of Waterloo.'.
-
National Flood Insurance Program. 2018. "The Cost of Flooding." In. Washington, DC: Department of Homeland Security.
-
National Safety Council. 2018. "Lifetime odds of death for selected causes, United States, 2018." In.
-
Natural Resources Canada. 2015. "Land Cover, circa 2000 – vector. Dataset. Used under the Open Government Licence – Canada." In, edited by Canada Centre for Mapping and Earth Observation Natural Resources Canada. GeoGratis Client Services.
-
———. 2017. "Constructions and Land Use in Canada - CanVec Series - Manmade Features." In National Vector Catalog Profile (NVCP). Ottawa Canada: Earth Sciences Sector, NRCan.
-
———. 2021. "Floods in Canada - Cartographic Product Collection." In. Federal Geospatial and Canada Open Government Data Platforms: Natural Resources Canada.
-
NBCC. 2015. " National Building Code of Canada 2015." In.: National Research Council.
-
Olson, Judy M. 1981. 'Spectrally Encoded Two-variable Maps', Annals of the Association of American Geographersî, 71: 259ñ76.
-
Onur, Tuna, and Mark Seeman. 2004. "Probabilities of significant earthquake shaking in communities across British Columbia: implications for emergency management." In 13th World COnference on Earthquake Engineering. Vancouver, British Columbia.
-
OSFI. 2013a. "Draft Guideline: Minimum Capital Test For Federally Regulated Property and casualty Insurance Companies." In, 69. Office of the Superintendent of Financial Institutions.———. 2013b. "Earthquake Exposure Sound Practices - Guideline B-9." In, 14. Office of the Superintendent of Financial Institutions.
-
Oulahen, Greg. 2015. 'Flood insurance in Canada: Implications for flood management and residential vulnerability to flood hazards', Environmental Management, 55: 603-15.
-
Parisien, Marc-André, V. G. Kafka, K. G. Hirsch, J. B. Todd, S. G. Lavoie, and P. D. Maczek. 2005. "Mapping wildfire susceptibility with the BURN-P3 simulation model. NRCan-Canadian Forest Service Informaiton Report NOR-X-405." In INFORMATION REPORT NOR-X-405, 45. Natural Resources Canada, Canadian Forest Service, Northern Forestry Centre ….
-
Partners in Protection. 2003. FireSmart: Protecting your community from wildfire (Partners in Protection).
-
Pesaresi, Martino, Daniele Ehrlich, Stefano Ferri, Aneta J. Florczyk, Sergio Freire, Matina Halkia, Andreea Julea, Thomas Kemper, Pierre Soille, and Vasileios Syrris. 2016. "Operating procedure for the production of the Global Human Settlement Layer from Landsat data of the epochs 1975, 1990, 2000, and 2014; JRC Technical Report EUR 27741." In JRC Technical Reports, edited by European Commission Joint Research Council.
-
Pesaresi, Martino, Daniele Ehrlich, Thomas Kemper, Alice Siragusa, Aneta J. Florczyk, Sergio Freire, and Christina Corbane. 2018. "Atlas of the Human Planet 2017: Global Exposure to Natural Hazards." In, edited by EU Joint Research Center, 92. EU Joint Research Center.
-
Peter, B., S. Wang, T. Mogus, and B. Wilson. 2006. 'Fire risk and population trends in Canada’s wildland–urban interface', Canadian wildland fire strategy: background synthesis, analysis, and perspectives’.(Eds KG Hirsch, P Fuglem) pp: 37-48.
-
Platt, Rutherford V. 2010. 'The wildland–urban interface: evaluating the definition effect', Journal of Forestry, 108: 9-15.
-
Ploeger, S. Kate, and Matthew J. Ladd. 2016. "Canadian Natural Hazards and Mitigation Strategy Reference Guide." In, 271. Public Safety Canada.
-
Pomeroy, John W., Ronald E. Stewart, and Paul H. Whitfield. 2016. 'The 2013 flood event in the South Saskatchewan and Elk River basins: Causes, assessment and damages', Canadian Water Resources Journal/Revue canadienne des ressources hydriques, 41: 105-17.
-
Public Safety, Canada. 2012. "All hazards risk assessment methodology guidelines 2012–2013." In, edited by Public Safety Canada, 85.
-
Public Safety Canada. 2013. "All Hazards Risk Assessment Methodology Guidelines." In, 85. Public Safety Canada.
-
———. 2021. "The Canadian Disaster Database." In.: Public Safety Canada.
-
Quarles, Stephen L., Yana Valachovic, Gary M. Nakamura, Glenn A. Nader, and Michael J. De Lasaux. 2010. 'Home survival in wildfire-prone areas: building materials and design considerations'.
-
Radeloff, V.C., R.B. Hammer, S.I. Stewart, J.S. Fried, S.S. Holcomb, and J.F. McKeefry. 2005. 'The wildland–urban interface in the United States.', Ecological Applications, 15: 799-805.
-
Renn, Ortwin, and Andreas Klinke. 2004. 'Systemic risks: a new challenge for risk management', European Molecular Biology Organization Reports, Special Issue, 5.
-
Rezaee, Sara, Ronald Pelot, and Joel Finnis. 2016. 'The effect of extratropical cyclone weather conditions on fishing vessel incidents’ severity level in Atlantic Canada', Safety science, 85: 33-40.
-
Rogelj, Joeri, Malte Meinshausen, and Reto Knutti. 2012. 'Global warming under old and new scenarios using IPCC climate sensitivity range estimates', Nature Climate Change, 2: 248-53.
-
Rogers, Gary, Stephen Halchuk, John Adams, and Trevor Allen. 2015. "Fifth Generation (2015) Seismic Hazard Model for Southwest British Columbia." In 11th Canadian Conference on Earthquake Engineering (11CCEE), 10. Victoria, BC.
-
Rudari, Roberto, Francesco Silvestro, Lorenzo Campo, Nicola Rebora, Giorgio Boni, and Christian Herold. 2015. "Improvement of the Global Flood Model for the GAR 2015, Input Paper prepared for the Global Assessment Report on Disaster Risk Reduction (2015)." In, edited by UNISDR, 69. Geneva: UNISDR.
-
Ruffman, Alan. 1996. 'The Multidisciplinary Rediscovery and Tracking of "The Great Newfoundland and Saint-Pierre et Miquelon Hurricane of September 1775" ', The Northern Mariner, 6: 11-23.
-
Sampson, Christopher C., Andrew M. Smith, Paul D. Bates, Jeffrey C. Neal, Lorenzo Alfieri, and Jim E. Freer. 2015. 'A high‐resolution global flood hazard model', Water resources research, 51: 7358-81.
-
Scawthorn, Charles, Neil Blais, Hope Seligson, Eric Tate, Edward Mifflin, Will Thomas, James Murphy, and Christopher Jones. 2006. 'HAZUS-MH flood loss estimation methodology I: overview and flood hazard characterization', Natural Hazards Review, 7: 60-71.
-
Scawthorn, Charles, Paul Flores, Neil Blais, Hope Seligson, Eric Tate, Stephanie Chang, Edward Mifflin, Will Thomas, James Murphy, Christopher Jones, and Michael Lawrence. 2006. 'HAZUS-MH flood loss estimation methodology II: damage and loss assessment', Natural Hazards Review, 7: 72-81.
-
Silva, Vitor, Desmond Amo-Oduro, Alejandro Calderon, Catarina Costa, Jamal Dabbeek, Venetia Despotaki, Luis Martins, Marco Pagani, Anirudh Rao, and Michele Simionato. 2020. 'Development of a global seismic risk model', Earthquake Spectra, 36: 372-94.
-
Silva, Vitor, Helen Crowley, Kishor Jaiswal, Ana Beatriz Acevedo, Massimilano Pittore, and J Murray Journeay. 2018. "Developing a Global Earthquake Risk Model." In 16th European Conference on Earthquake Engineering, 12. Thessal, Grece.
-
Silva, Vitor, Helen Crowley, Marco Pagani, Damiano Monelli, and Rui Pinho. 2014. 'Development of the OpenQuake engine, the Global Earthquake Model’s open-source software for seismic risk assessment', Natural Hazards: 1-19.
-
Simmons, D. C., C. Corbane, S. Menoni, S. Schneiderbauer, I. Kavvadas, P. Kockerols, A. M. Molnar, P. Quevauviller, and F. Villette. 2017. 'Understanding disaster risk: risk assessment methodologies and examples', Science for disaster risk management.
-
Simonovic, Slobodan P., and Richard W. Carson. 2003. 'Flooding in the Red River Basin – lessons from post flood activities ', Natural Hazards, 28: 345-65.
-
Stanley, Thomas, and Dalia B. Kirschbaum. 2017. 'A heuristic approach to global landslide susceptibility mapping', Natural Hazards, 87: 145-64.
-
Statistics Canada. 2012. "Population growth in Canada: From 1851 to 2061." In, edited by Statistics Canada, 5.
-
———. 2016. "The 2016 Census of Population." In.: Statistics Canada.
-
Stewart, Susan I., Bo Wilmer, Roger B. Hammer, Gregory H. Aplet, Todd J. Hawbaker, Carol Miller, and Volker C. Radeloff. 2009. 'Wildland-urban interface maps vary with purpose and context', Journal of Forestry, 107: 78-83.
-
Stocks, B. J., J. A. Mason, J. B. Todd, E. M. Bosch, B. M. Wotton, B. D. Amiro, M. D. Flannigan, K. G. Hirsch, K. A. Logan, and D. L. Martell. 2002. 'Large forest fires in Canada, 1959–1997', Journal of Geophysical Research: Atmospheres, 107: FFR-5.
-
Stocks, Brian J., T. J. Lynham, B. D. Lawson, M. E. Alexander, C. E. Van Wagner, R. S. McAlpine, and D. E. Dube. 1989. 'Canadian forest fire danger rating system: an overview', The Forestry Chronicle, 65: 258-65.
-
Stover, Carl W., and Jerry L. Coffman. 1993. Seismicity of the United States, 1568-1989 (revised). U. S. Geological Survey Professional Paper 1527 (US Government Printing Office).
-
Swiss Re. 2019. "Wildfire in Canada: fostering resilience through advances in modelling." In, 13.
-
Taylor, Harvey Thurm, Bill Ward, Mark Willis, and Walt Zaleski. 2010. 'The Saffir-Simpson hurricane wind scale', Atmospheric Administration: Washington, DC, USA: 5.
-
Taylor, S.W., R.G. Pike, and M.E. Alexander. 1996. "Field Guide to the Canadian Forest Fire Behaviour Prediciton (FBP) System." In, edited by Canadian Forest Service, 84. Victoria Canada.
-
Taylor, Stephen William, and Martin E. Alexander. 2018. Field guide to the Canadian Forest Fire Behavior Prediction (FBP) System.
-
Teufel, Bernardo, G. T. Diro, K. Whan, S. M. Milrad, D. I. Jeong, A. Ganji, O. Huziy, K. Winger, J. R. Gyakum, and R. de Elia. 2017. 'Investigation of the 2013 Alberta flood from weather and climate perspectives', Climate Dynamics, 48: 2881-99.
-
Trigg, M. A., C. E. Birch, J. C. Neal, P. D. Bates, A. Smith, C. C. Sampson, D. Yamazaki, Y. Hirabayashi, F. Pappenberger, and E. Dutra. 2016. 'The credibility challenge for global fluvial flood risk analysis', Environmental Research Letters, 11: 094014.
-
Tyagunov, Sergey, Patrick Heneka, Lothar Stempniewski, Jochen Zschau, Bodo Ruck, and Christopher Kottmeier. 2006. "CEDIM: From multi-hazards to multi-risks." In ARMONIA Conference. Barcelona, Spain.
-
Ulbrich, U., G. C. Leckebusch, and Joaquim G. Pinto. 2009. 'Extra-tropical cyclones in the present and future climate: a review', Theoretical and Applied Climatology, 96: 117-31.
-
UNDP Global Risk Data Platform. 2015. "Global Flood Hazard Model." In.
-
UNISDR. 2015. "GAR Global Risk Assessment: Data, Methodology, Sources and Usage." In, edited by UNISDR, 37. Geneva.
-
United Nations. 2016. "Report of the Open-Ended Intergovernmental Expert Working Group on Indicators and Terminology Relating to Disaster Risk Reduction (A/71/644)." In, edited by United Nations General Assembly, 41. Geneva.
-
USDA and USDI. 2001. "Federal Register Notices- Daily Journal of the United States Government." In, 751-77. United States Government.
-
Van Wagner, C. E. 1987. "Development and structure of the Canadian Forest Fire Weather Index System." In Forestry Technical Report 35, edited by Canadian Forestry Service, 48. Ottawa, ON: Petawawa National Forestry Institute.
-
Vickery, Peter J., Jason Lin, Peter F. Skerlj, Jr. Lawrence A. Twisdale, and Kevin Huang. 2006. 'HAZUS-MH hurricane model methodology. I: hurricane hazard, terrain, and wind load modeling', Natural Hazards Review, 7: 82-93.
-
Vickery, Peter J., Peter F. Skerlj, Jason Lin, Jr. Lawrence A. Twisdale, Michael A. Young, and Francis M. Lavelle. 2006. 'HAZUS-MH Hurricane Model Methodology. II: damage and loss estimation', Natural Hazards Review, 7: 94-103.
-
Wald, D.J., C.B. Worden, Vincent Quitoriano, and Kris Pankow. 2006. "ShakeMap Manual: Technical Manual, User Guide and Software Guide." In Advanced national Seismic System, edited by US Geological Survey, 156. US Geological Survey.
-
Wald, David J., Vincent Quitoriano, Thomas H. Heaton, Hiroo Kanamori, Craig W. Scrivner, and C. Bruce Worden. 1999. 'TriNet “ShakeMaps”: Rapid Generation of Peak Ground Motion and Intensity Maps for Earthquakes in Southern California', Earthquake Spectra, 15: 537-55.
-
Wang, Xianli, Marc-André Parisien, Steve W. Taylor, Jean-Noël Candau, Diana Stralberg, Ginny A. Marshall, John M. Little, and Mike D. Flannigan. 2017. 'Projected changes in daily fire spread across Canada over the next century', Environmental Research Letters, 12: 025005.
-
Wood, Harry O., and Frank Neumann. 1931. 'Modified Mercalli intensity scale of 1931', Bulletin of the Seismological Society of America, 21: 277-83.
-
Worden, C. B., M. C. Gerstenberger, D. A. Rhoades, and D. J. Wald. 2012. 'Probabilistic relationships between ground‐motion parameters and modified Mercalli intensity in California', Bulletin of the Seismological Society of America, 102: 204-21.
-
Wotton, Brian Michael, Martin E. Alexander, and Stephen William Taylor. 2009. Updates and revisions to the 1992 Canadian forest fire behavior prediction system (Great Lakes Forestry Centre).
-
Yamin, Luis E., Alvaro I. Hurtado, Alex H. Barbat, and Omar D. Cardona. 2014. 'Seismic and wind vulnerability assessment for the GAR-13 global risk assessment', International Journal of Disaster Risk Reduction, 10: 452-60.
Report a problem on this page
- Date modified: