Abstract
This is the abstract.
| Column 1 | Column 2 | Column 3 | Column 4 |
|---|---|---|---|
This column’s content and borders are rendered using the table header ( |
|
This column’s content is bold ( |
This column’s content is italicized ( |
This column’s content and borders are rendered using the table header ( |
|
This column’s content is bold ( |
This column’s content is italicized ( |
1. Introduction
A brief introduction to Pathways and the role of the platform in delivering the science outputs. Emphasis on evloving nature of the platform.
2. Platform Requirements
To support the Pathways activities a platform with the following features and attributes was required:
-
Supports open and collaborative development of science outputs
-
Centralizes access to the science outputs
-
Provides tools and applications to engage the public and support decision making
The generation of science outputs is becoming increasingly reliant on software code to automate processing, quality control, and publishing. Considerable attention was paid to alignment with best practices for Open Science (i.e., FAIR Principles) and scientific software code (i.e., R5 Principles).
The scale and scope of the data involved in the project necessitated an approach that not only streamlined the production of science-based outputs, but also provided for a high degree of collaboration across many disciplines (e.g., policy, technology, and science) and stakeholders (e.g., provincial, municipal).
Decision support requirements were well understood at the outset. A comprehensive set of requirements for a multitude of stakeholders was developed [1]. The diversity of the stakeholders and their specific needs necessitated a multi-channel approach since a single application was deemed to be insufficient to serve all use cases effectively.
With development led out of the Government of Canada the platform had to comply with requirements for publishing science outputs including standardized metadata, open data, support for both official languages, accessibility, and compliance with scientific integrity and publication policies. The scientific integrity and publishing requirements were particularly problematic as they traditionally pushed the development of the science behind closed doors. To comply with policy while supporting the objectives of the project, a balanced approach that prioritizes openness and transparency is needed.
3. Overview
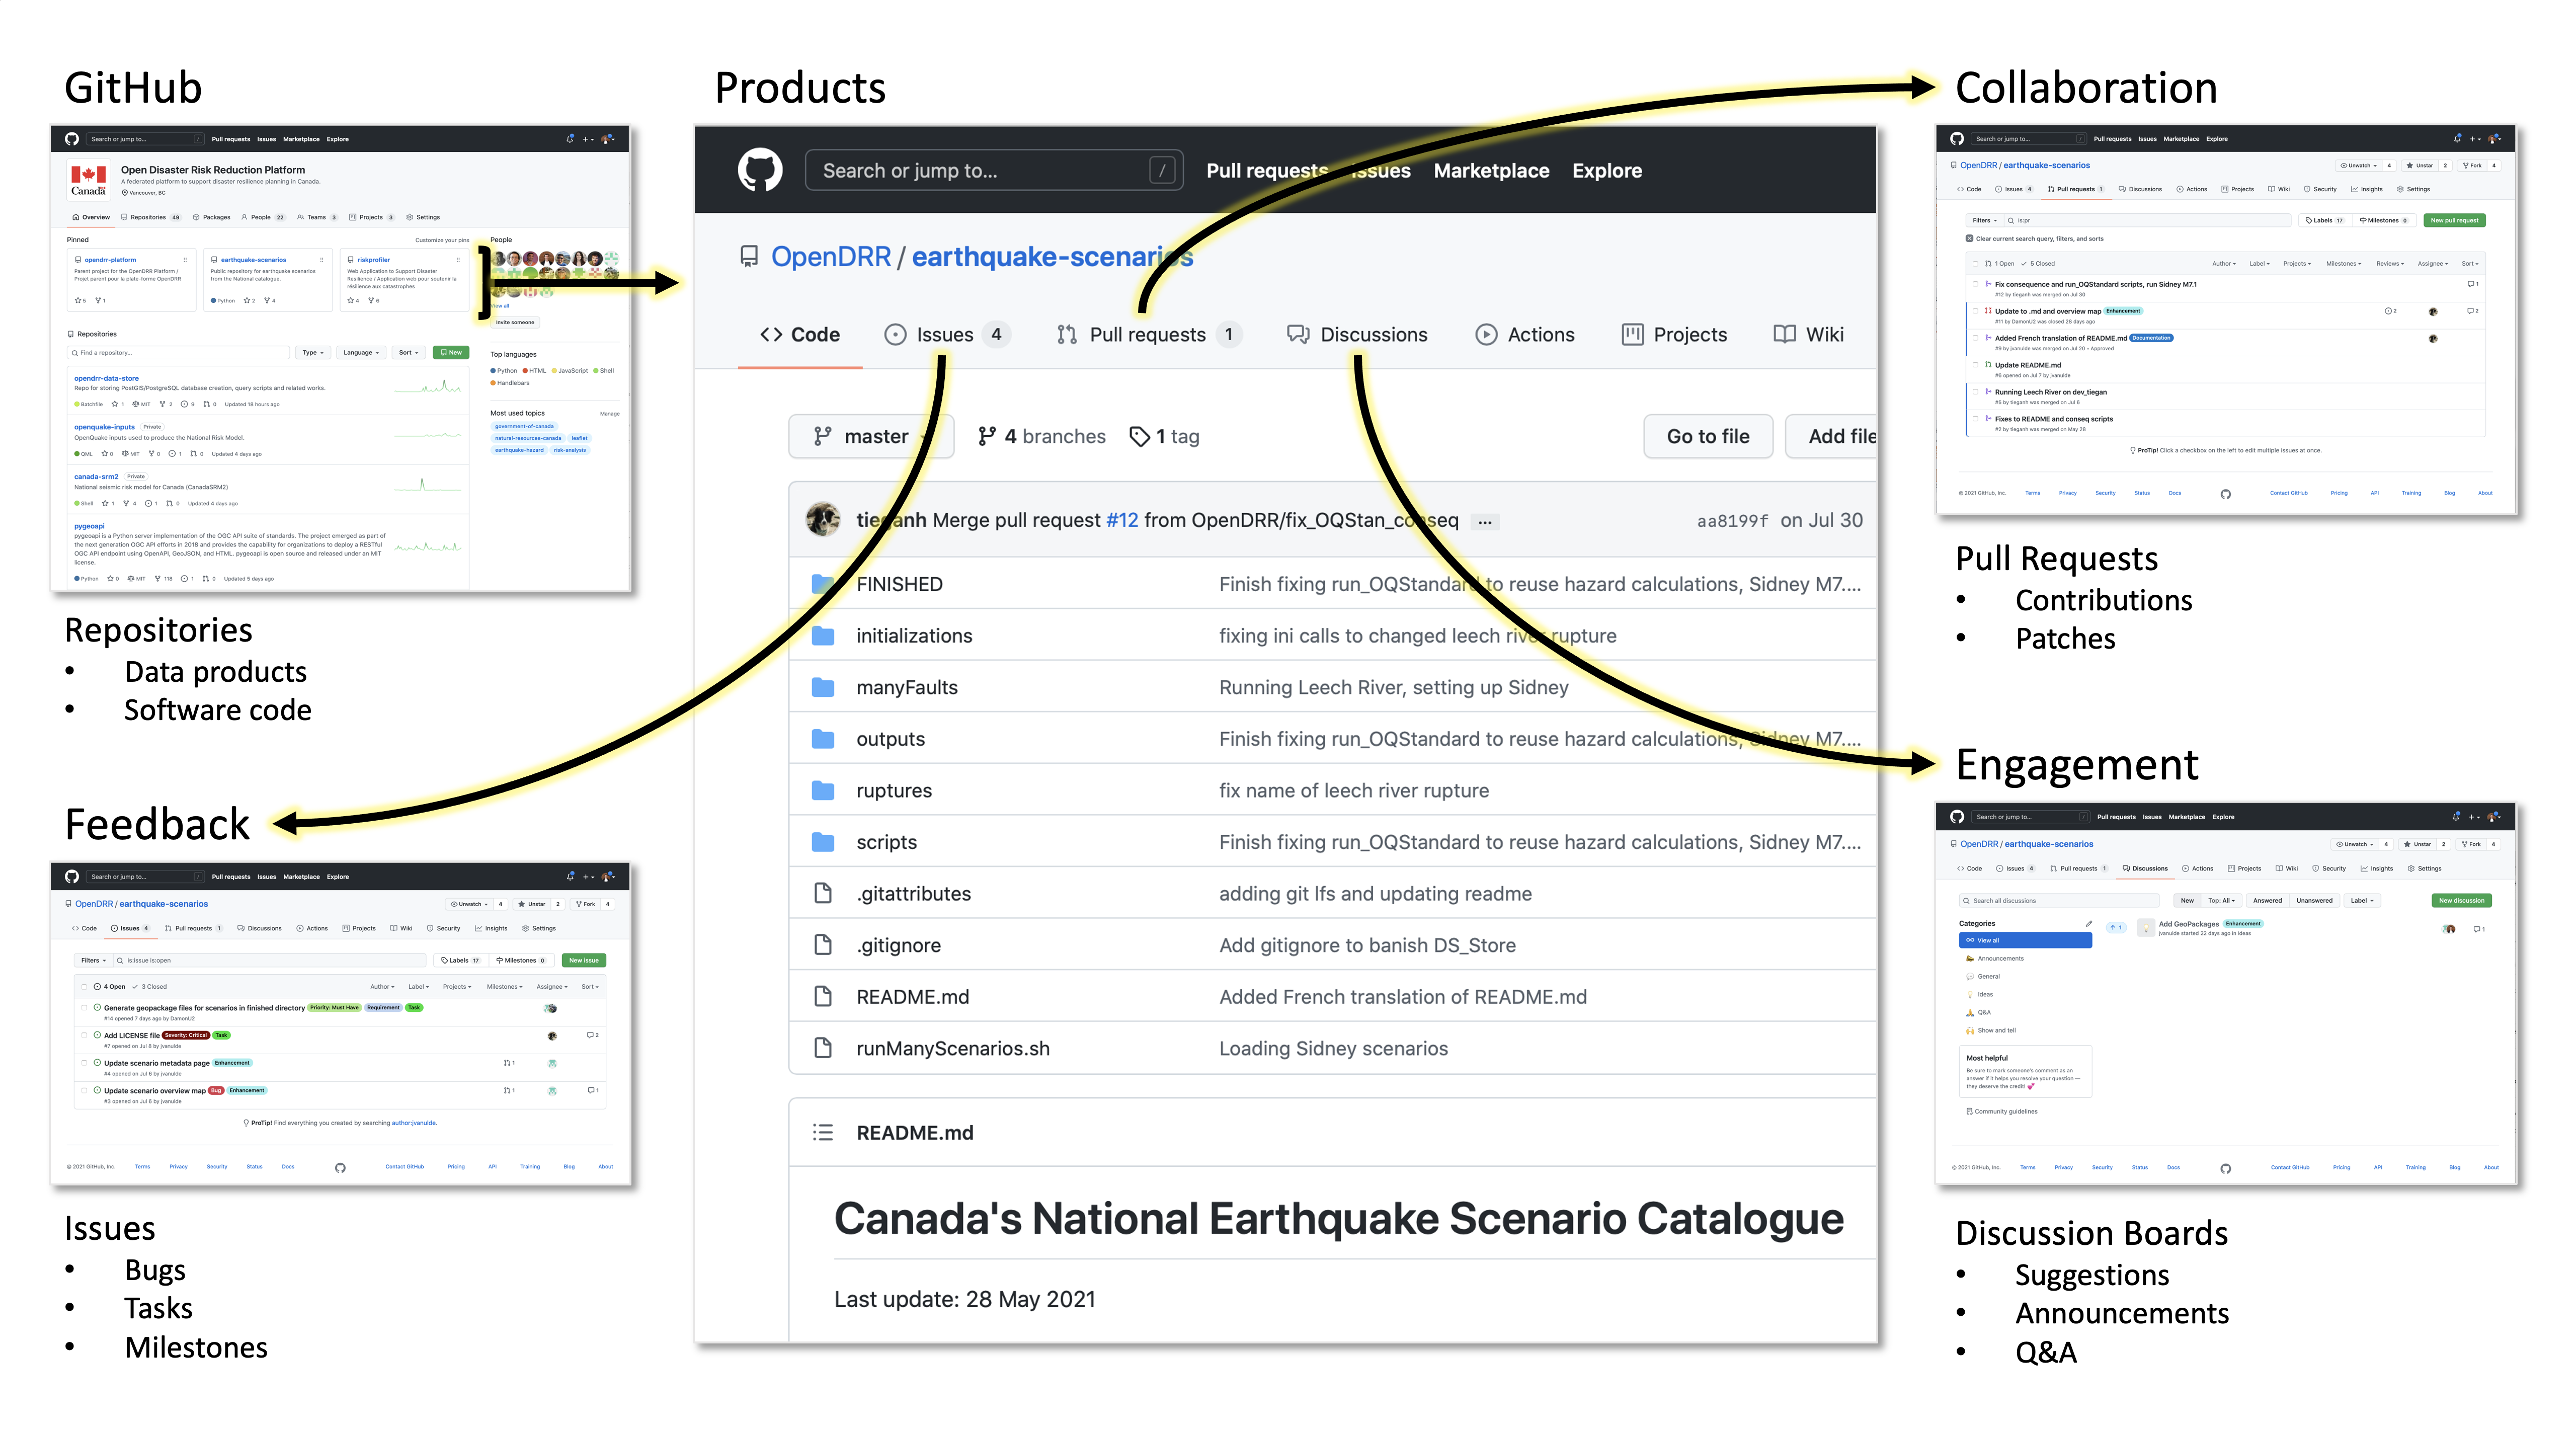
GitHub was chosen as the platform to support the development of the science outputs and related software, documentation, and tools. While well known in the software development community, it is lesser-known in the science community. However, the core concepts behind GitHub (e.g., versioning, repositories) were more or less understood by key contributors.
Where possible, runnable code is available to ensure transparency in the science. For example, an interested party could clone a repository and replicate a particular output, e.g., a dataset or even the entirety of the OpenDRR infrastructure. The platform makes heavy use of containerization and infrastructure as code technologies for rapid deployment on personal computing devices or the cloud.
Built-in features of GitHub such as continuous integration and deployment, community building, websites, and secure workspaces are tools for achieving an open and collaborative approach to science, one that seeks to build consensus and drive engagement throughout its lifecycle.
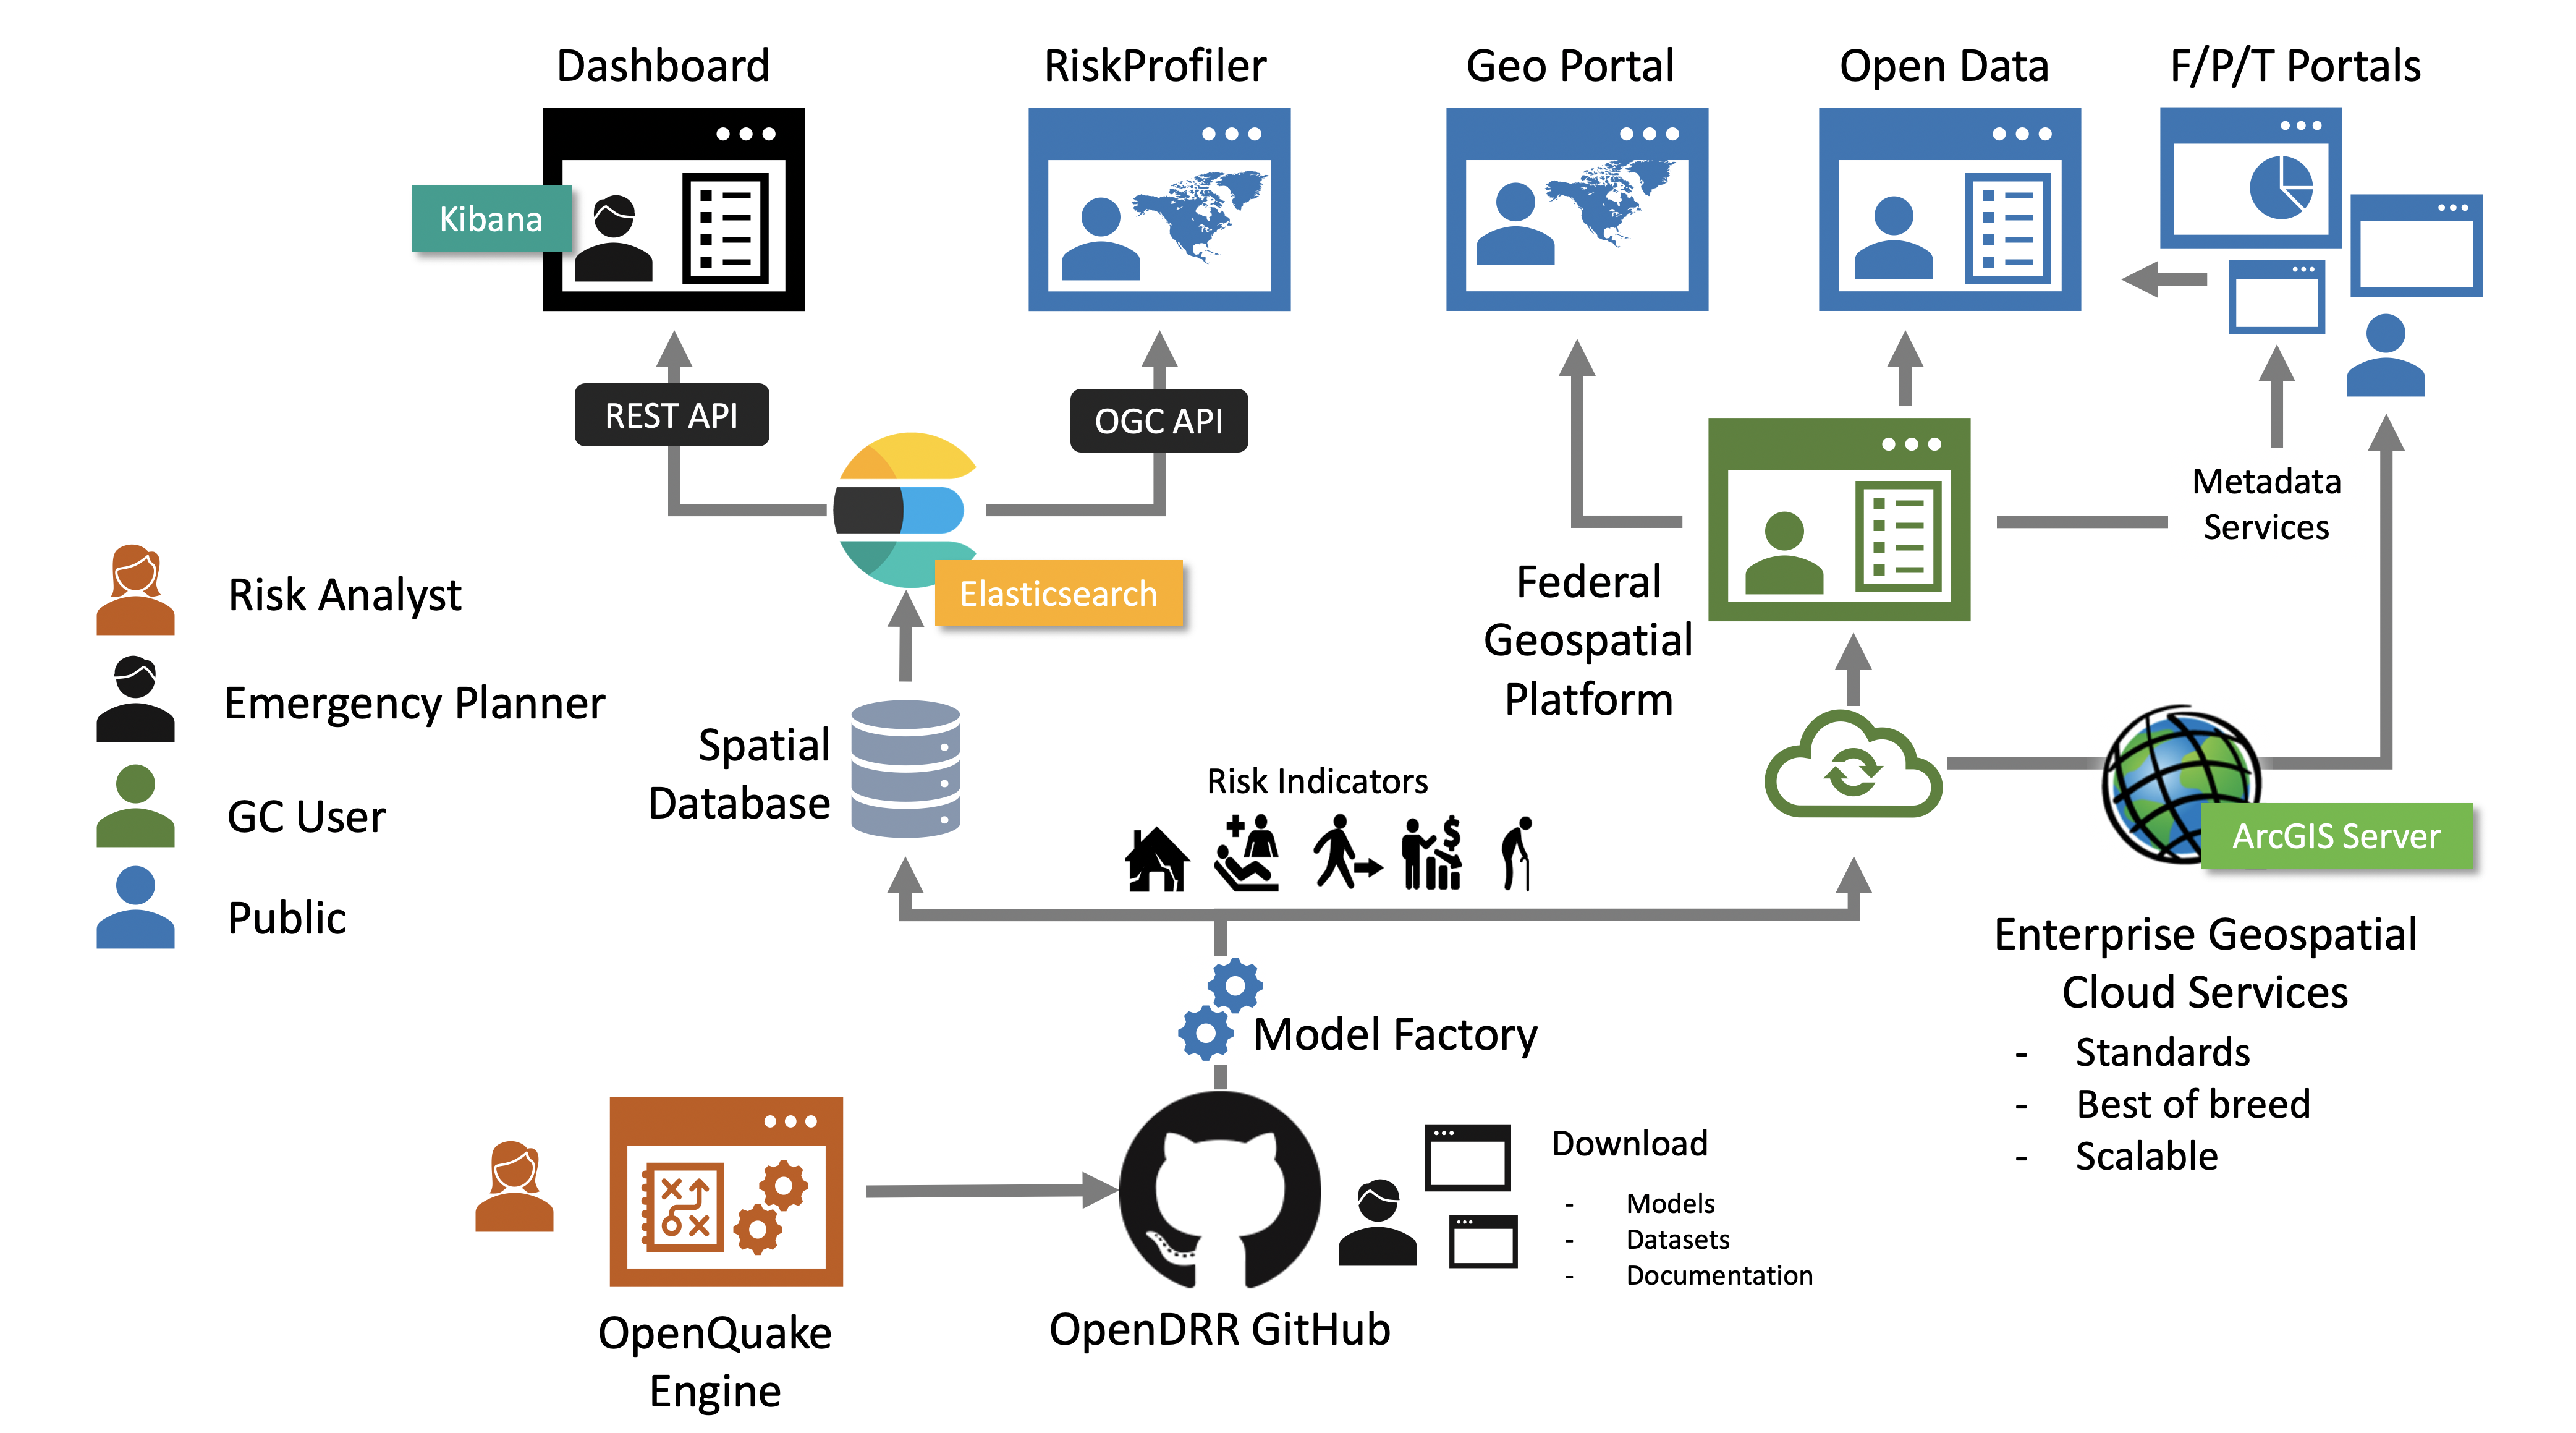
Due to the diversity of use cases and user profiles for the information products (e.g., maps, visualizations), it was clear that a single solution would not be sufficient. It was determined that a purpose-built web application and a dashboard environment would be required to meet the needs of all users.
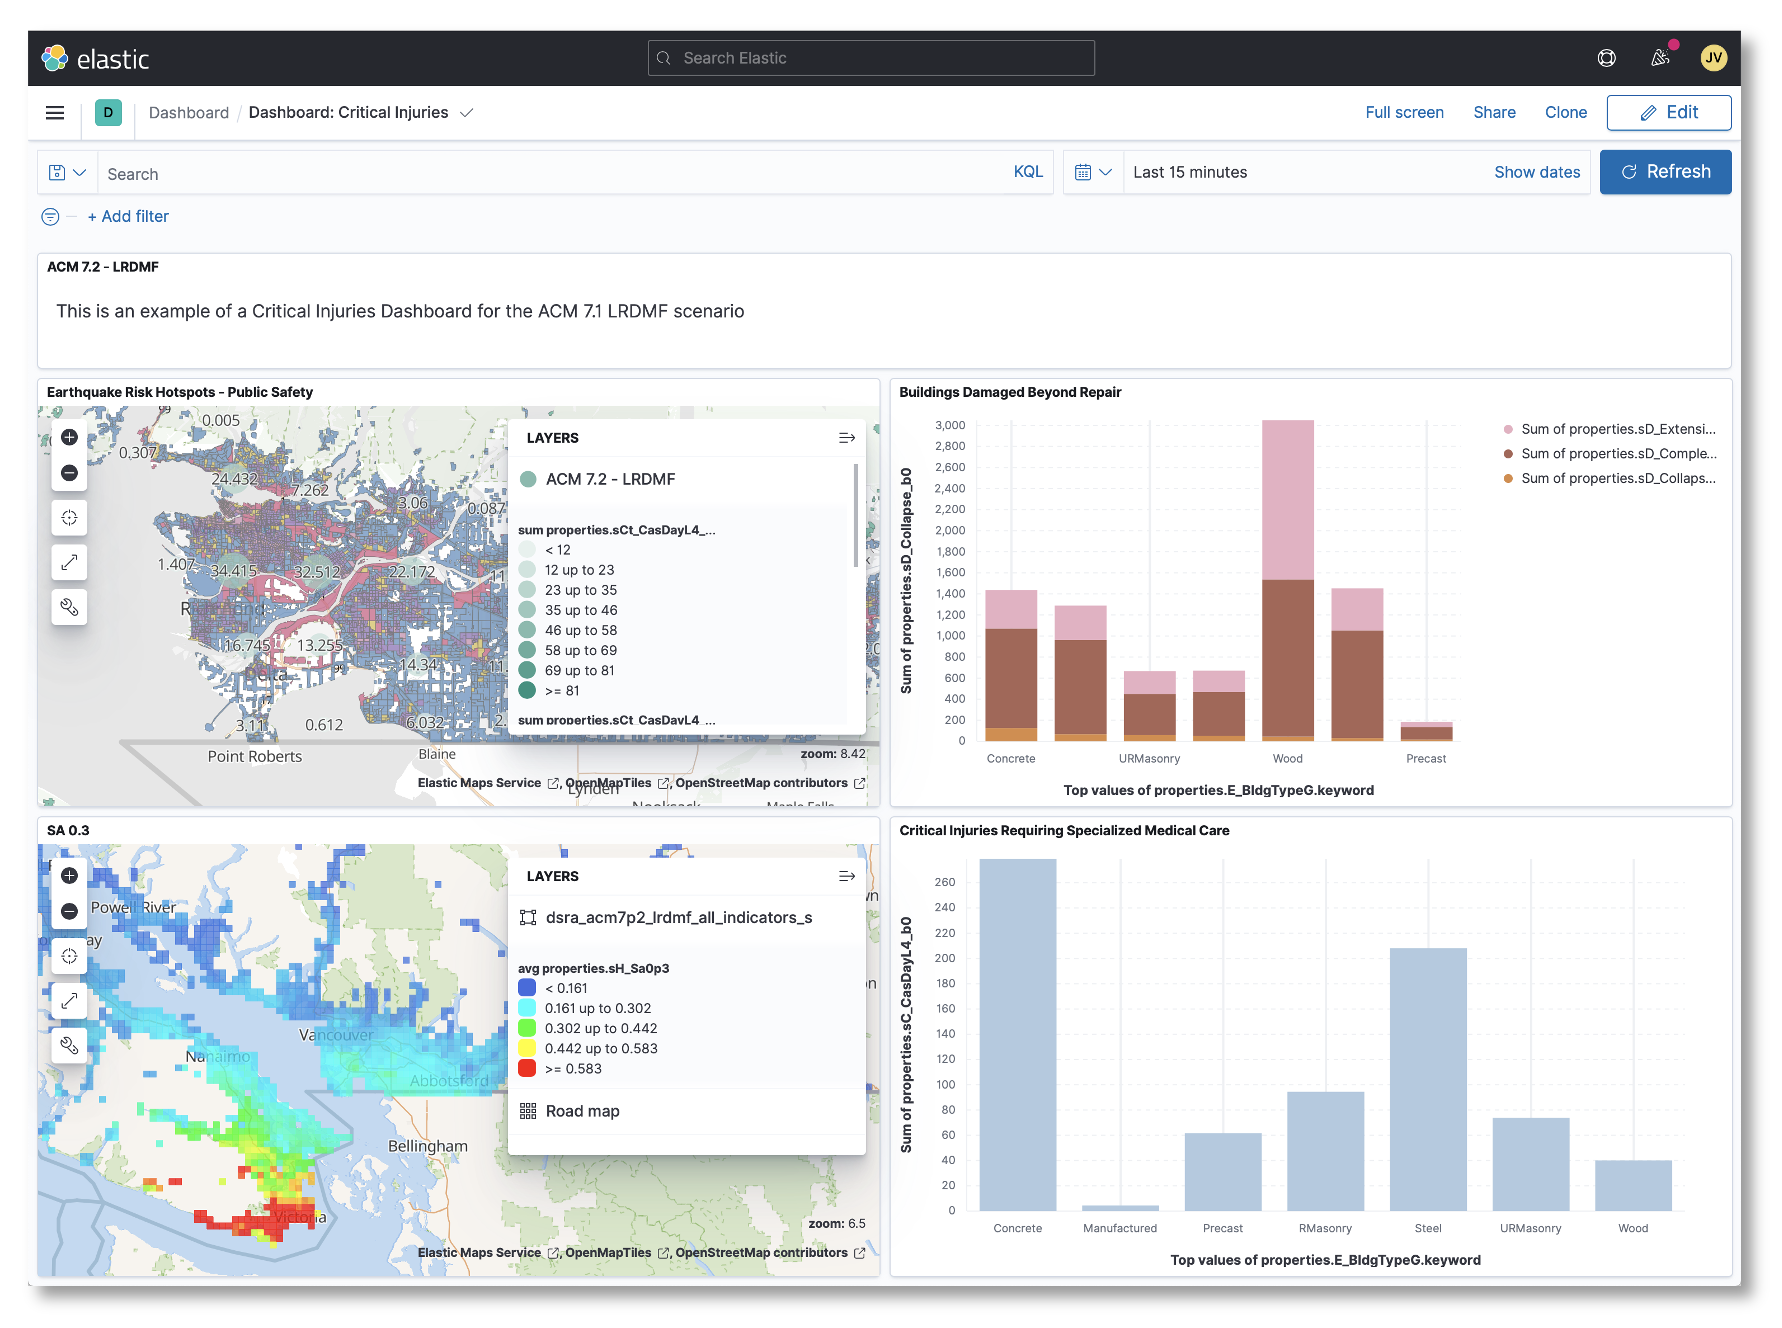
The dashboard environment, provided by Kibana [2] connects to an Elasticsearch document store. This environment is highly customizable and allows individuals and organizations to create public or private spaces where they can query and intuitively visualize all available data.
The purpose-built application, called RiskProfiler [3] is a custom web application. Built to be highly scalable and user-friendly, it seeks to communicate the key messages relating to natural hazard risk. It provides basic filtering and visualization in an area of interest, such as a community or region.
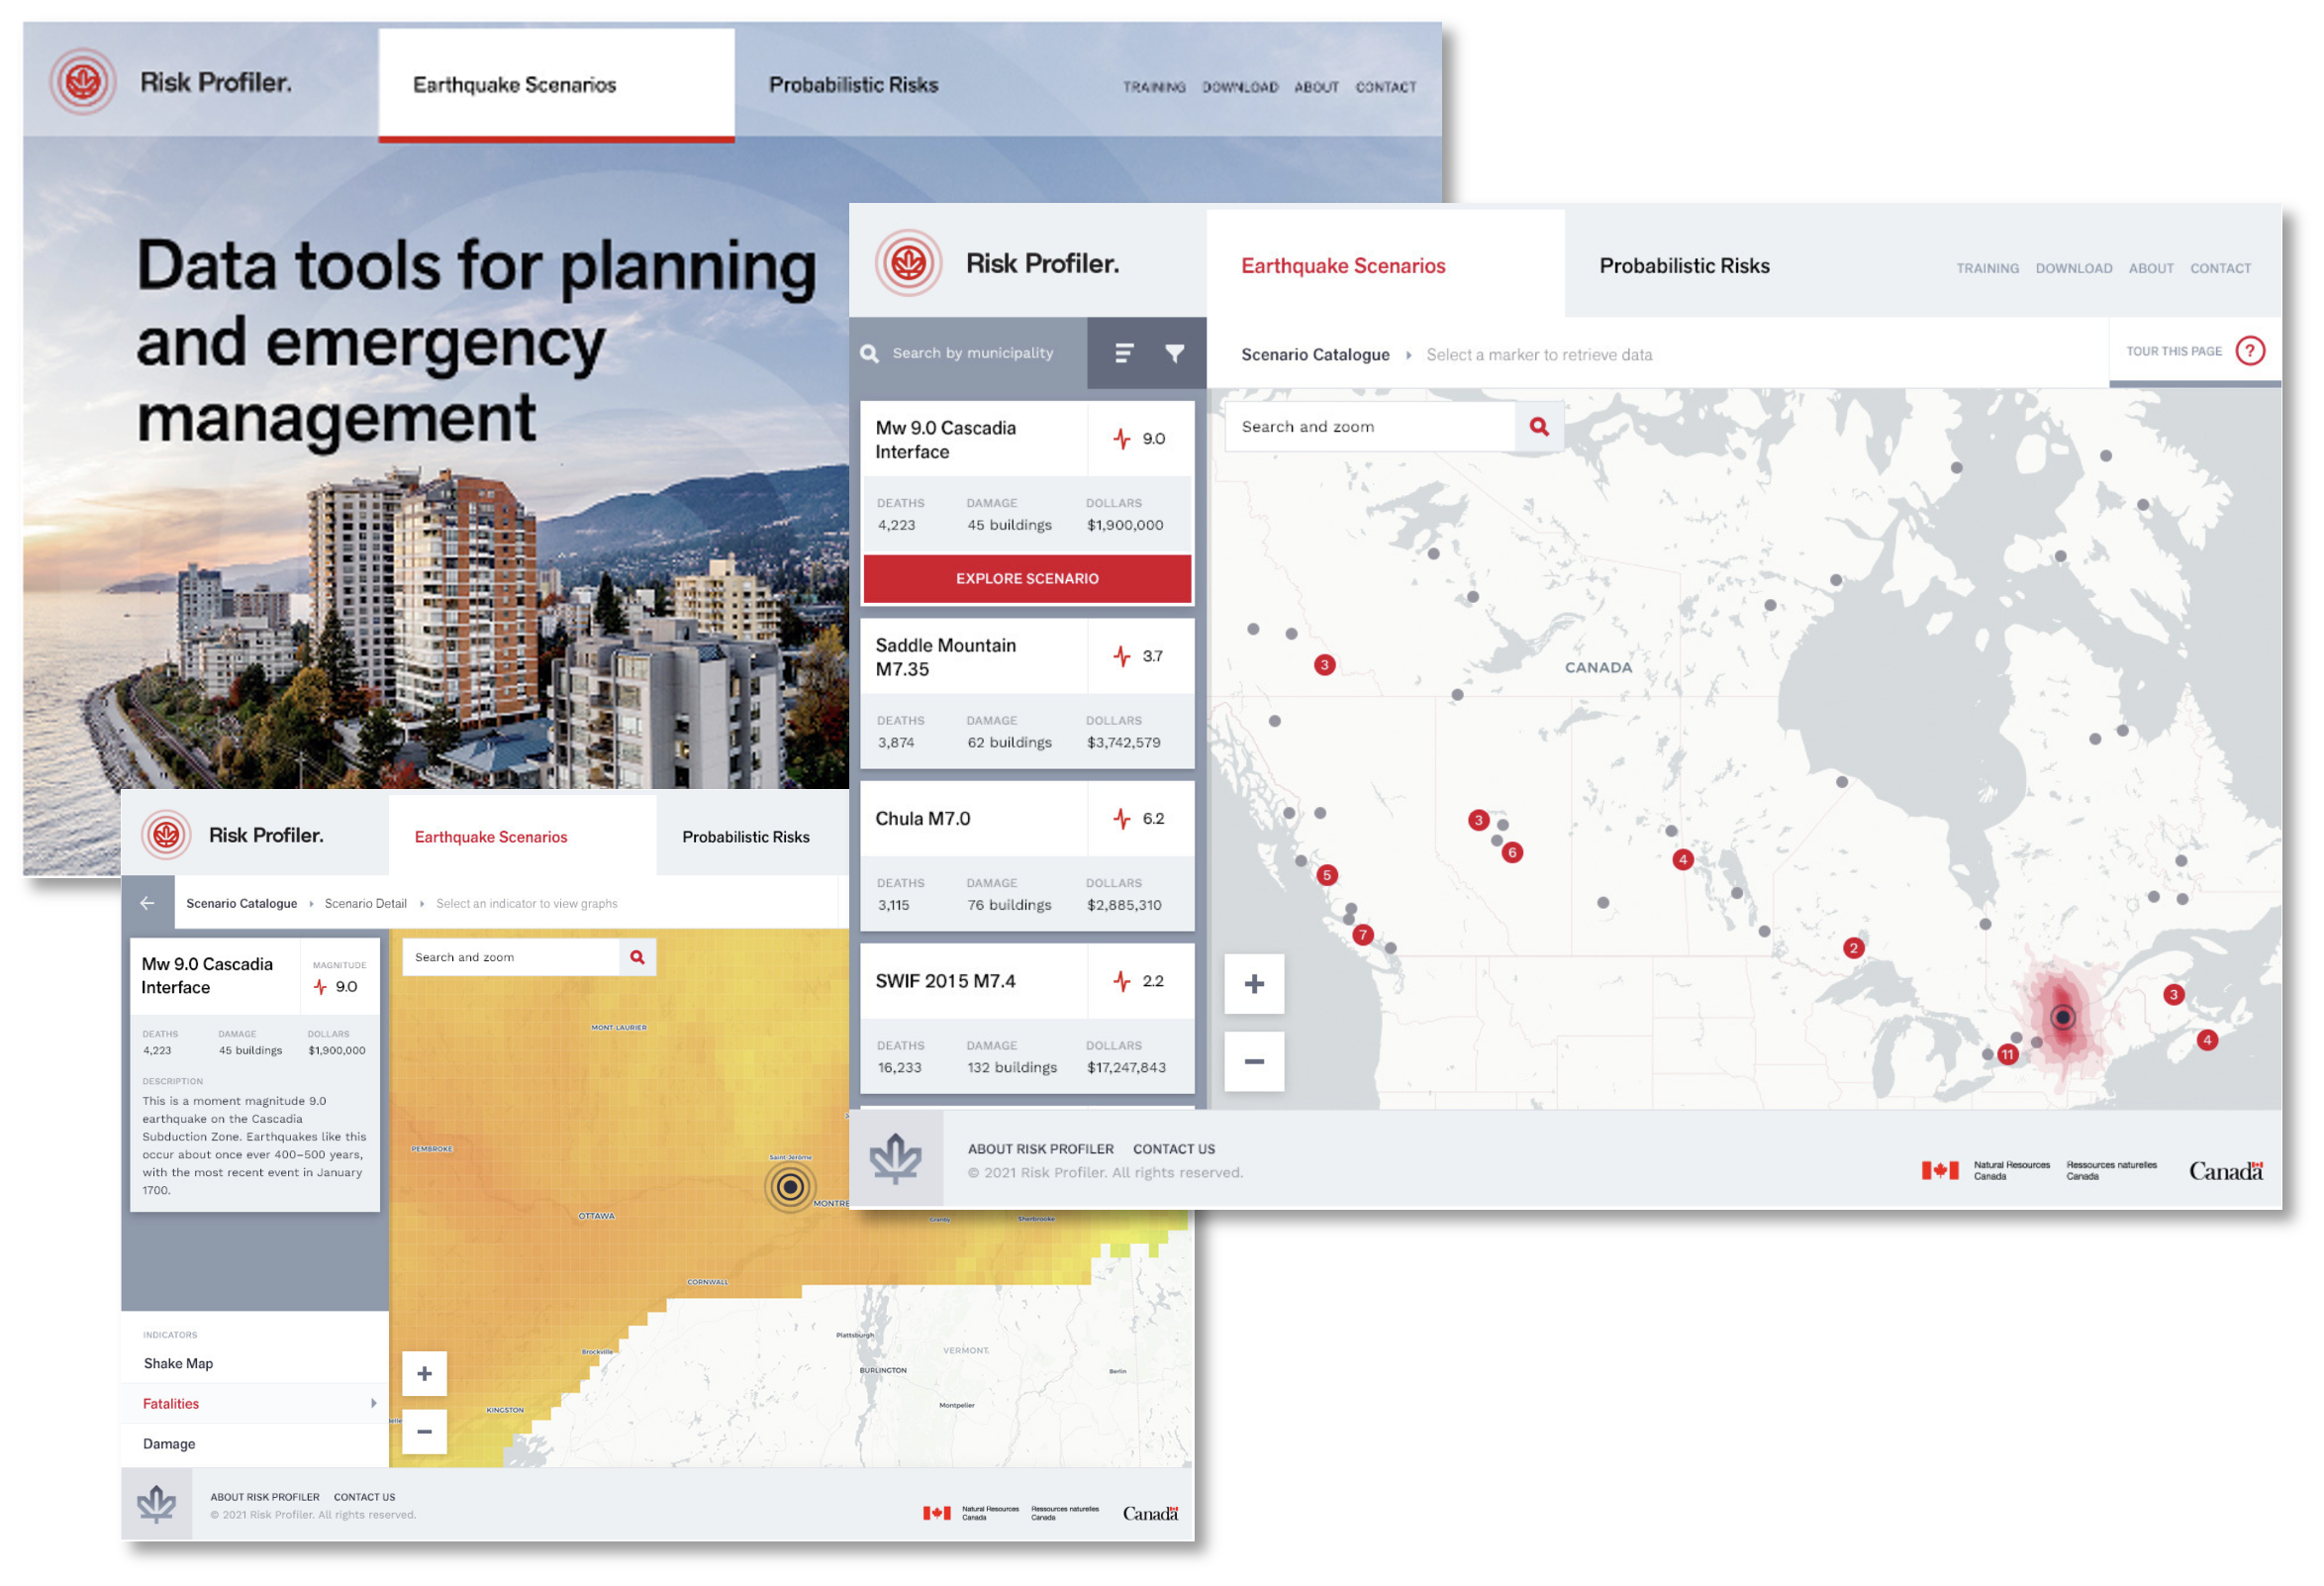
In the initial release, RiskProfiler will focus primarily on earthquake risk, but the intention is to include additional natural hazard risk assessments, e.g., flood, wildfire, landslides, and tsunami.
4. Architecture
Brief description of achitecture with goals/principles.
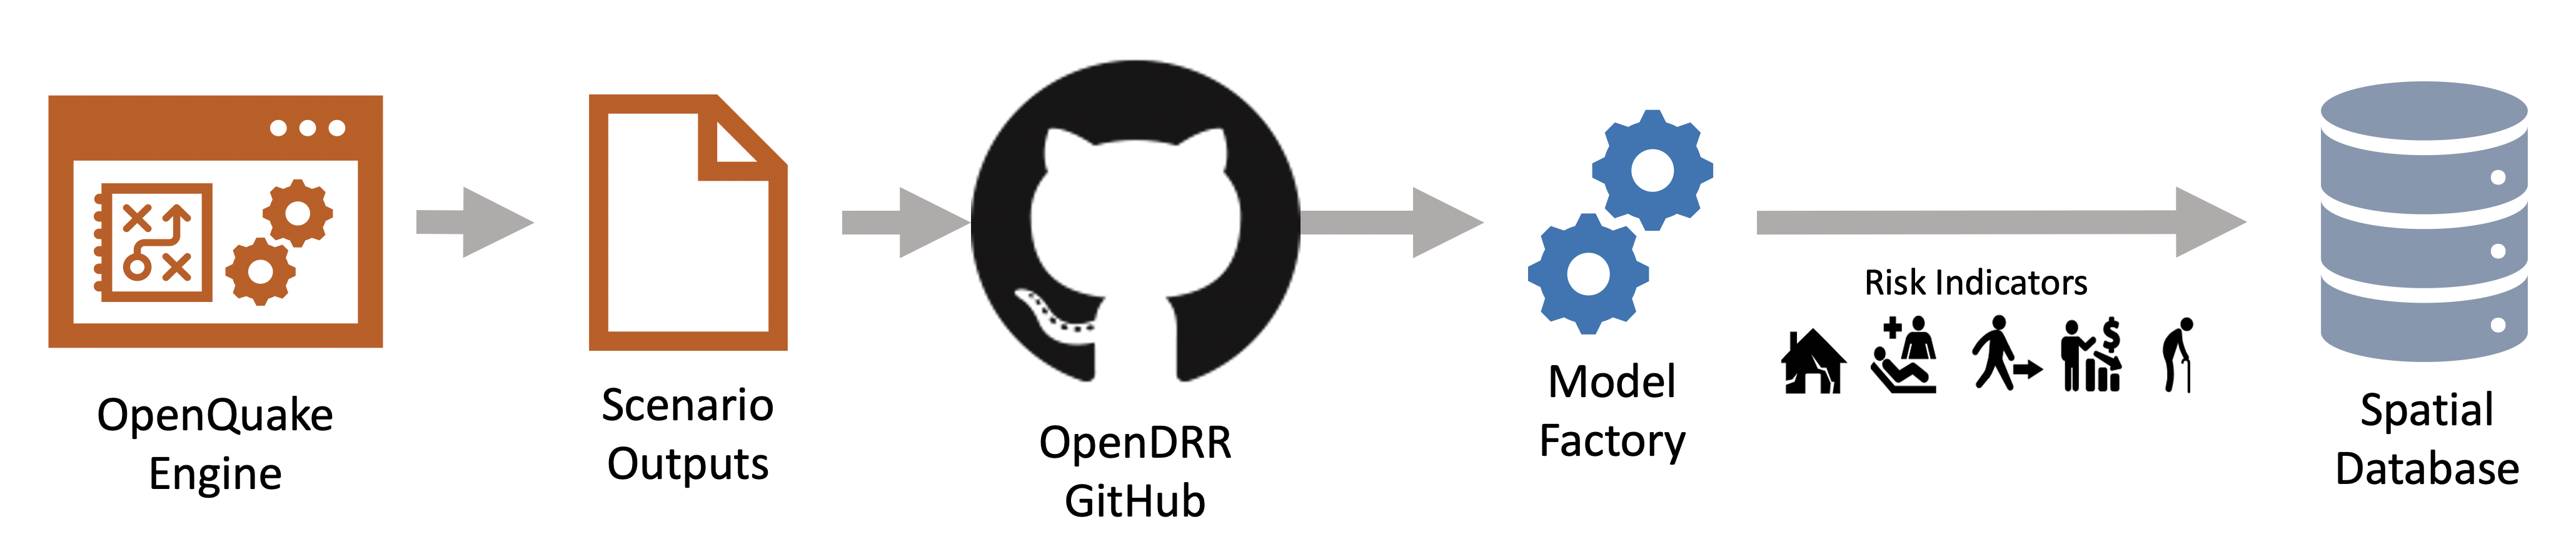
Source data for this project includes the National Human Settlement Layers (physical exposure and social vulnerability), the National Seismic Risk model for Canada (CanadaSRM2, probabilistic), Canada’s National Earthquake Scenario Catalogue (deterministic), and boundary geometries are stored in the Open Disaster Risk Reduction Platform (OpenDRR) organisation on GitHub.
4.1. Data Processing Pipeline
The OpenDRR platform data processing pipeline is responsible for extracting, transforming and loading (ETL) data. It consists of several open source technologies, namely PostgreSQL with PostGIS extension, Python, ElasticSearch/Kibana, and PyGeoAPI. Each of the applications is containerized using separate Docker containers orchestrated with Docker-Compose.
The stack of technologies can be configured to run on a local machine with PostgreSQL and ElasticSearch environments running locally or can be configured to communicate with cloud deployments of these services. For example, the stack can be configured to communicate simultaneously with a PostgreSQL database on Amazon Web Services (AWS) Relational Database Service (RDS) and a Containerized ElasticSearch environment on an AWS Elastic Container Service (ECS). A common use case is to run the ETL process on a local desktop or AWS Elastic Compute Cloud (EC2) with a local containerized PostgreSQL environment and a cloud deployed ElasticSearch environment which can support a public or private application programming interface (API).
The ETL process currently relies on a main shell script titled 'add_data.sh' which downloads the required source data files including comma separated value (csv), and GeoPackages (gpkg) into the local filesystem and performs necessary transformations to load the data into a PostgreSQL database. The script is written to be flexible enough to load any number of conformant deterministic earthquake scenarios and national seismic risk model data? and allows some flexibility in the contents of the input data as long as a minimal number of required fields are present. Once the required source data has been loaded into the database, a number of Structured Query Language (SQL) scripts help transform the data into a framework of meaningful earthquake risk indicators which in turn gets pushed to ES/Kibana ??? .
Discuss the postgresql database? Briefly? Schemas? The PostgreSQL database is created and has PostGIS extension enabled to allow for spatial data queries. The source datas are loaded into their respected schema names and the results are generated into their respected schemas with results_ prefix.????
Results are calculated and/or aggregated at different spatial scales dependent on the data. For National Human Settlement Layers the results are in settled areas. The probabilistic and deterministic data are calculated at the building level and aggregated up to the settled area and census subdivision levels.
These results are aggregated at several different spatial scales, building, sauid, and csd level. The building level is the finest spatial resolution and aggregates all buildings of similar construction type for a given neighbourhood. The Sauid level of aggregation groups all building types across the whole neighbourhood polygon. The Census Sub-division (CSD) aggregation is a coarse aggregation of all assets within a given CSD as defined by Statistics Canada.
4.2. Data Dissemination
The data dissemination architecture includes API’s and applications that are designed to provide multiple channels for access to scientific datasets and products.
4.2.1. GitHub
OpenDRR data products are made available in Geopackage [4] (GPKG) format in their respective repositories on GitHub. Datasets can be found in release assets for each release of the product and so they are versioned to ensure that consumers are using the most up-to-date data.
Checksums are also provided for each file in a dataset so that consumers can verify the integrity of the data, an important consideration for any data being used to support decision making.
4.2.2. API Stack
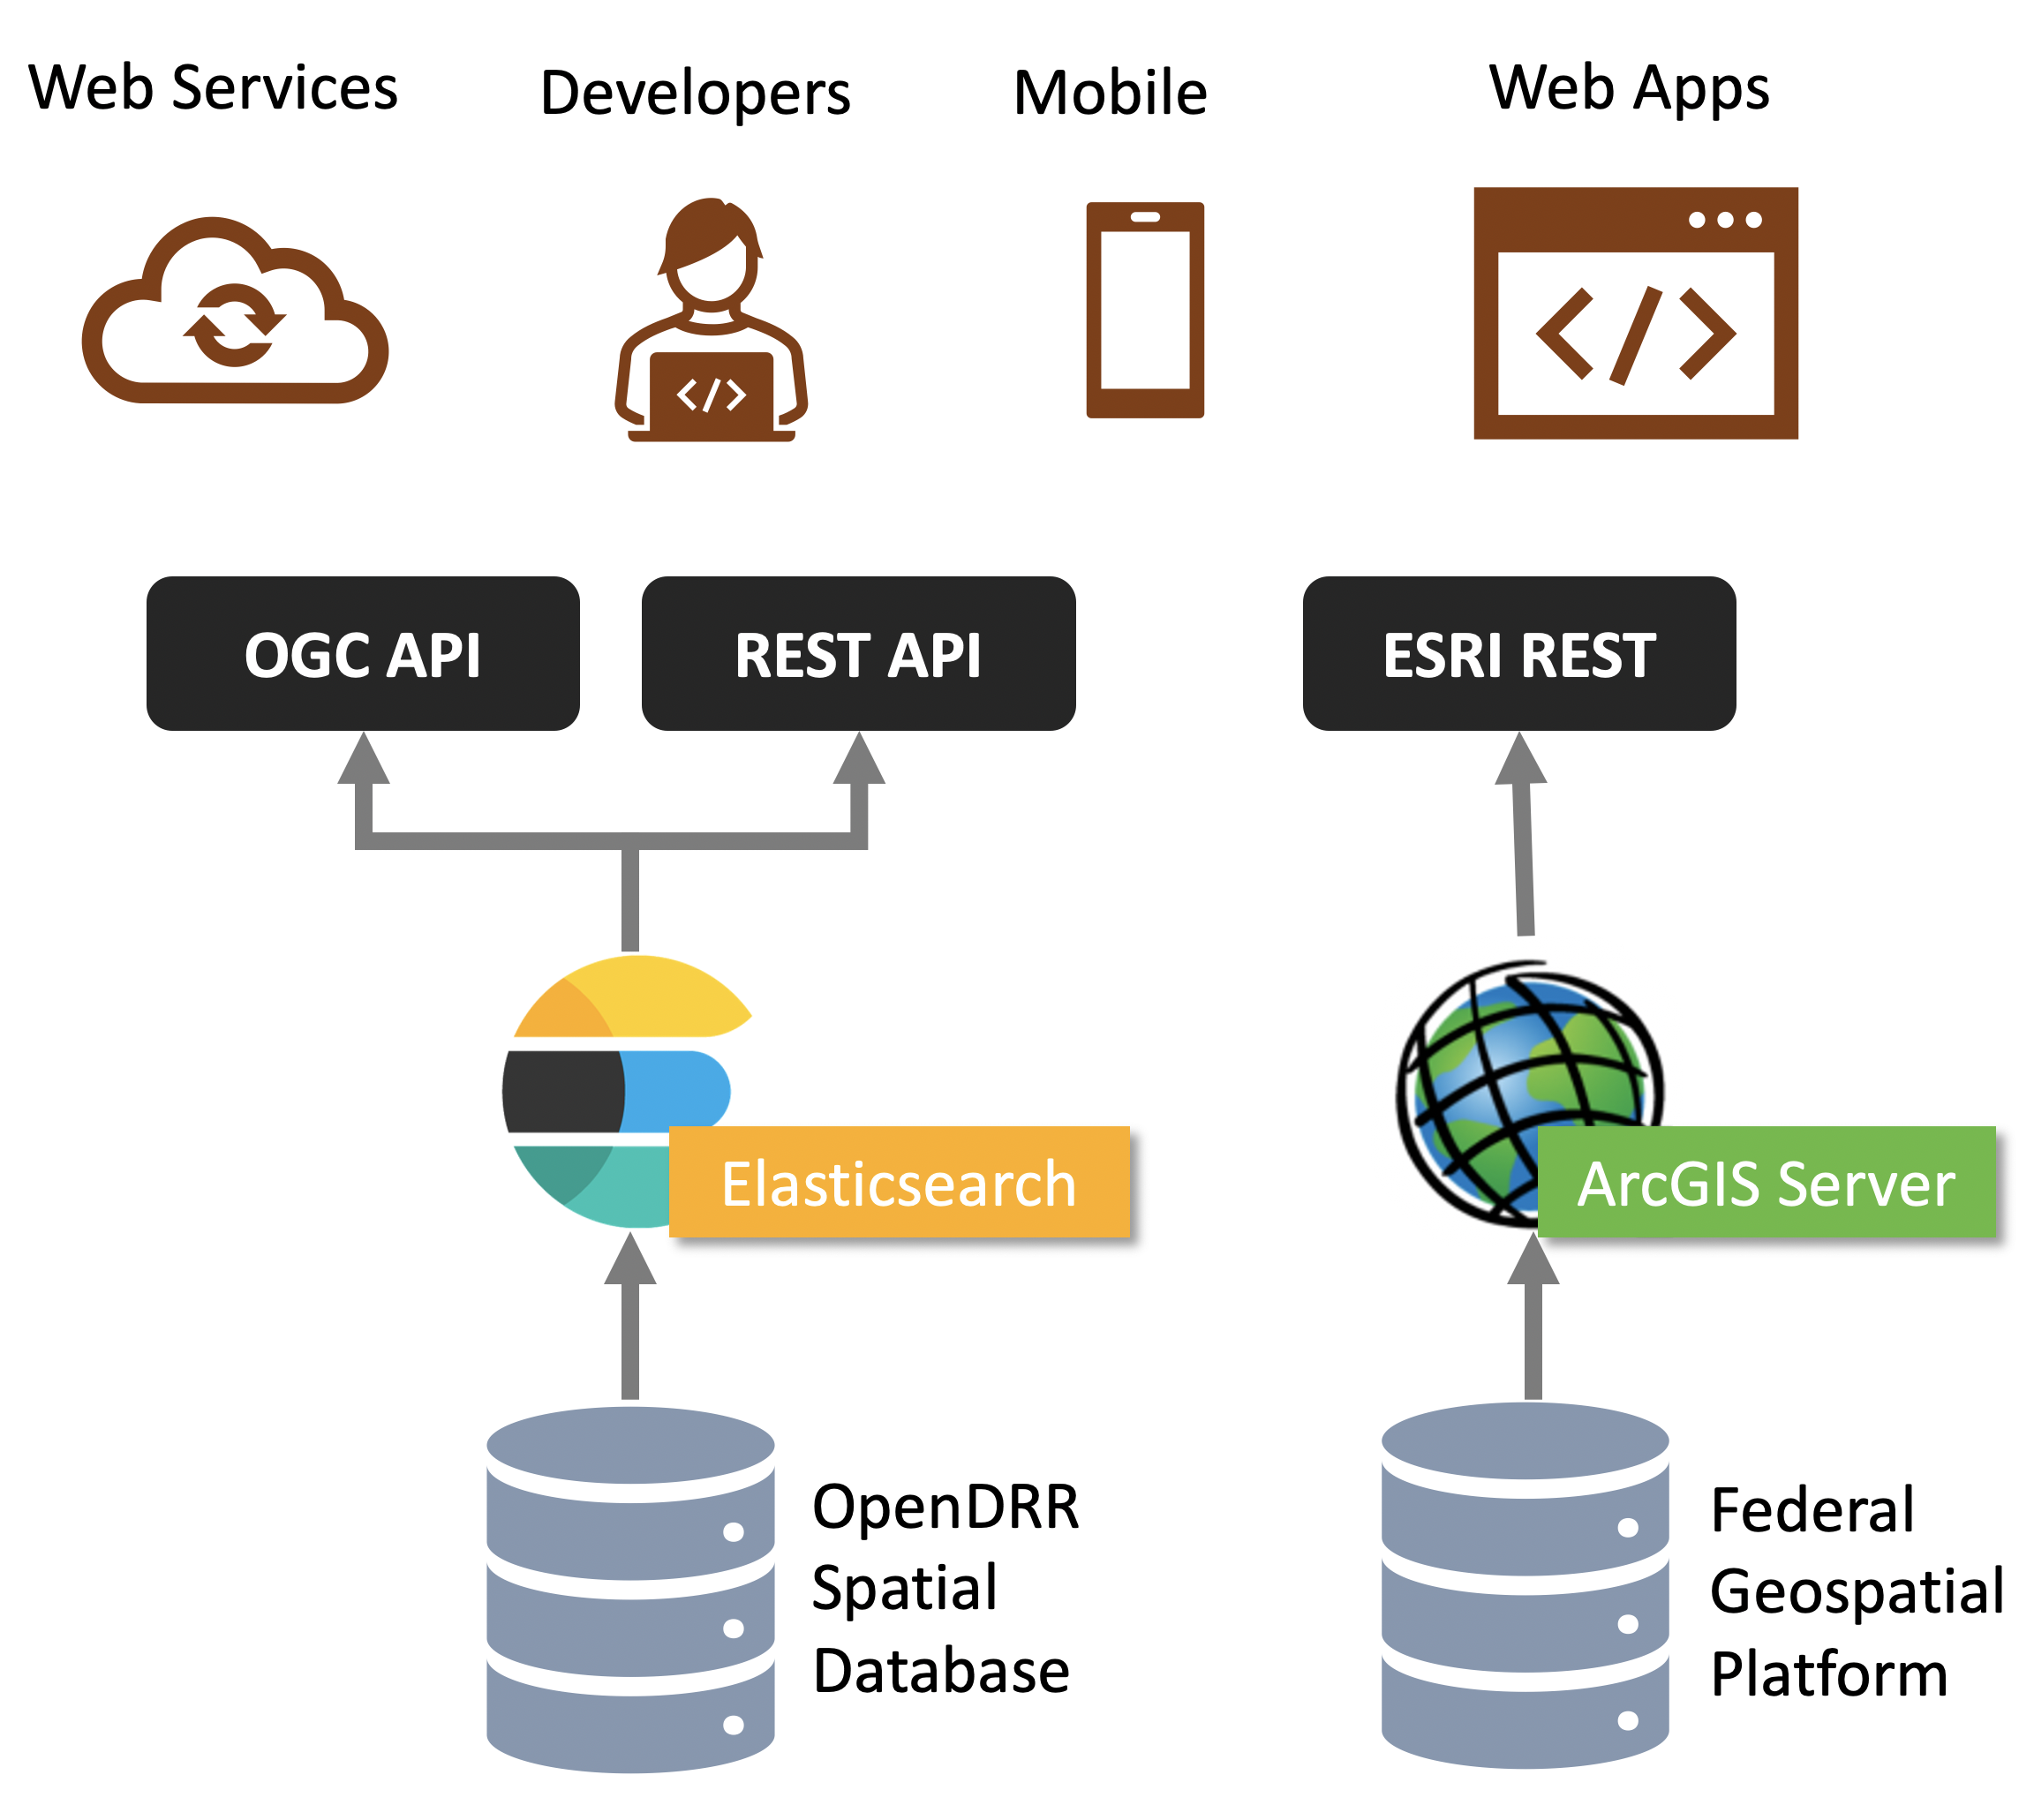
The API stack is comprised of three REST endpoints:
OGC API - Features
Complying with Open Geospatial Consortium (OGC) [5] standards, it provides a geospatial data endpoint for GIS application developers. It is implemented using pygeoapi [6] deployed in a Docker container. Pygeoapi is connected to an Elasticsearch document store.
A developer portal is provided that can be used to formulate and test queries against the API. At the time writing the API supports basic querying due to the evolving nature of OGC API - Features Part 3: Filtering and the Common Query Language (CQL).
|
Note
|
pygoapi also provides an OGC API - Records [7] endpoint that is being explored for future use as a metadata API. |
Elasticsearch
The Elasticsearch API follows REST [8] best practices. Configured as a read-only (i.e.: HTTP GET verb) it allows for access to datasets and their properties. Using a proprietary query syntax, developers can issue queries to return summary statistics, geospatial features, and feature properties.
The Elasticsearch API provides data to the Kibana dashboard application [9]. Developers can set up an account in the Kibana dashboard where query formulation and testing tools are provided.
Esri
The Federal Geospatial Platform (FGP) is a Government of Canada clearinghouse for geospatial data. The FGP provides enterprise-grade geospatial infrastructure and support services to facilitate the dissemination of data. OpenDRR datasets are hosted on the FGP and made available via Esri REST services for organizations that utilize Esri based tools and applications.
4.2.3. RiskProfiler
-
wordpress static site
-
utilizes API’s
-
user profiles: emergency planner, risk manager
-
browse by region of interest
-
Deterministic and probabilistic models
-
downloads
-
training
4.2.4. Kibana Dashboard
The Kibana [10] Dashboard is intended to support a more sophisticated use case than that of RiskProfiler. Initially, it was imagined that RiskProfiler would serve all stakeholders however, after engaging with the risk community [11], it was evident that a dashboarding application would be well received.
The Dashboard allows users to create workspaces where they can collaborate with others on data visualizations and reports. The entirety of available data in OpenDRR is available to Dashboard users. These data are hosted in Elasticsearch and it is therefore identical with what is available via the Elasticsearch API. Users can add or link additional datasets to "mash-up" Pathways data with their own.
Users can create reports, data visualizations, and maps for an area of interest. Visualizations can be exported and embedded in presentations and websites. This is the first of such platform to be made available to the Public with national scale risk data.
5. Lessons Learned
5.1. Working in the Open
Working in the open is standard practice in the software community, but this is not the case in the scientific community. Despite many science-based institutions promulgating FAIR [12] and Open Science [13], they largely ignore the very principles upon which these are based. Instead of working in the open from the outset, science continues to be carried out behind closed doors until such time that a final product is formally published.
The science-based organisation under which the OpenDRR platform is being developed decided to take a more liberal approach, open by default but closed where required. Unfortunately, internal policies regarding Open Science were not yet fully developed, so the default approach was to do much of the actual science modeling and development in private repositories until peer review can be completed. An unfortunate consequence of misguided but well-intentioned policies (e.g.: NRCan’s Scientific Integrity Policy).
While not ideal, the platform did demonstrate that peer-review of science using GitHub was tractable. Transparency in the science that informs government policy is an important part of any democracy, and so the platform will continue to aspire towards a future where policy-driven decisions are supported by data that is aligned with the principles of FAIR and Open Science.
5.2. Continuous Integration
It was readily apparent early in the development process that automation would be beneficial. In software development continuous integration is a technology that integrates sub-systems into larger systems on some pre-determined event (e.g. tests have completed successfully for an update such as a bug fix). In the case of OpenDRR continous integration is used for software integration and data integration.
When new datasets are added and/or models are updated automated, tasks are run to deploy new services, downloadable assets, and metadata. This saves a significant amount of effort and reduces the amount of time it takes to make these assets available to the community.
In the case of OpenDRR software code, continuous integration scripts are used to prepare and publish containerized solutions, generate database scripts, generate configuration files, and run tests. Deploying systems into the cloud via continuous integration is in active development and this is expected to further reduce the level of effort to deploy the software stack.
5.3. Security
Example: Apache Log4j vulnerability
Built-in features in GitHub helped to ensure that code was secure and up to date (e.g.: dependabot).
-
We got confirmation from ITSEC that our ES endpoint was attacked. Since we were running 7.12.0 the attack failed. Lesson: keep your software up to date. (Credit: Joost,)
-
(a little bit about) keeping up-to-date vs. compatibility-breaking changes (e.g. Python 3.8 to 3.9); be prepared for extra work hours (manpower?) to resolve compatibility issues during upgrade…
5.4. The Software Development Lifecycle
The intersection of science delivery and software development has traditionally been carried out indpendent of each other, that is the science is completed and then the system is developed. With a very ambitious delivery schedule it was decided to do both in parallel.
The Pathways OpenDRR development utilized the scrum process with two-week iterations. Tasks were assigned to each iteration and reported on every two weeks. The complexity of the products being developed necessitated a tight coupling of the raw science outputs with custom software and continuous integration processes.
This tight coupling presented a number of challenges. Firstly, it was immediately apparent that a high degree of flexibility would need to be designed into the software to accommodate constantly changing data schemas. Secondly, the development of the science outputs moved at a much slower pace as it required collaboration with other scientists (e.g.: peer reviews). The two week interation cycle resulted in too much overhead on the development of the science outputs, and as a consequence engagement with the science staff suffered.
5.5. Github
The use of GitHub as a platform for the development of the science outputs was well recieved and uptake was high. The core concepts of Git were well understood and the distributed nature of the platform proved to be a benefit during the COVID 19 pandemic, which saw most project participants working remotely, often disconnected from the enterprise network. Fine grained control over access to repositories and associated assets was a critical factor in the success of the platform to support Open Science.
The 100MB file size restriction imposed by the GitHub platform was an issue for some repositories. Thankfully, GitHub provides an alternative storage called "Git Large File Storage" (Git LFS) which was enabled on many repositories. Bandwidth quotas for Git LFS were exceeded. GitHub provides 1GB of free storage and 1GB per month of free bandwidth. Additional costs were incurred to increase the quotas.
To mitigate the potential of increasing costs for managing large files a strategy of including datasets and files in the realease assets of a repository was adopted. GitHub allows for release assets (e.g.: files, datasets) up to 2GB to be stored and disseminated at no cost.
6. Future Development
6.1. Additional natural hazard types
The initial requirement focused on earthquake risk with a desire to include other natural hazard types (e.g. landslides, wildfires, flooding, tsunami). Due to time and resource constraints the decision was made to focus on earthquake risk and bring in additional hazards when the platform was more mature.
There are a number of ways in which additional hazards can be added. They can be integrated fully or partially depending on the nature of the data and the capacity of the responsible party. For example, at the the most basic level a repository could be set up for each hazard type and the datasets, stored as release assets, could be easily propogated to the dissemination infrasctucure by way of existing processes. More advanced approach would be to generate the datasets from within the platform as it currently done for Earthquakes. The later approach would require a fair amount of scripting (e.g. Python, Shell) to achieve, but not impossible.
The RiskProfiler web application is being developed in such a way that it could be extended to include other natural hazard types.
6.2. Engagement
To engage the public more effectively and efficiently respond to queries about the science, the project will leverage the Discussions module in GitHub. The Discussions module can support FAQ’s, general discussions, collection of feedback, or any other type of engagement. Typically, the primary researcher would have to respond to queries on an ad hoc basis, a time-consuming but necessary task. The Discussions module could reduce the level of effort to support science hosted in repositories.
Other opportunities to engage with the user community will be explored as time/resources permit.